
Waning Energy
The energy sector placed last in performance in 2019, and the sector is getting used to being in last place or close to it. It placed last in 2018 and second to last in 2017. The last place sector in 2017, communication services, went on to do great things, placing second in 2019. Numerous Wall Street analysts have been using the buzz words “mean reversion” when it comes to the energy sector. A simple definition of mean reversion is the tendency for prices to move to the average over time. The question we ask ourselves any time we hear mean reversion is, “Why?” Why should performance in the sector revert to the mean? What are the catalysts for a change in direction of performance? We discuss a few of our thoughts on the sector in this edition of Insight Extra.
Three-year performance
In the chart below we show three-year indexed performance for the S&P 500 Index, the S&P 500 excluding the energy sector and the S&P 500 Energy sector exclusively. Dispersion in performance between the S&P 500 Index and the S&P 500 Energy Sector Index has increased significantly over the period. The spread in performance over the period was over 6,000 basis points – 62.5%.
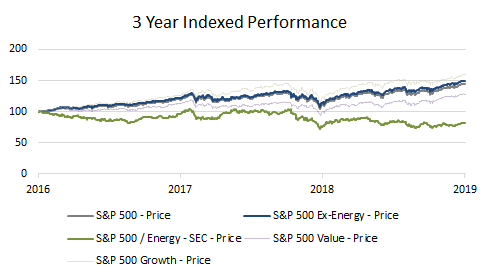
Another interesting outcome illustrated above is the growth/value spread. A contributing factor to growth’s significant outperformance versus value over the period can be attributed to the respective weight of the energy sector in each index. The S&P 500 Growth Index has a 1% allocation to energy, the Value Index weight is over 7%. Excluding energy from the indices greatly narrows the dispersion in performance.
| Index | One-year return | Three-year return |
| S&P 500 / Energy – Price | 11.81 | -9.34 |
| S&P 500 – Price | 31.49 | 53.17 |
| S&P 500 Ex-Energy – Price | 30.06 | 49.43 |
| S&P 500 Value – Price | 31.93 | 38.57 |
| S&P 500 Growth – Price | 31.13 | 67.1 |
Factset
The weight of the sector within broad market indices has been evolving over the last few years. In the graph below, we see a decrease in the weight allocation to energy in the S&P 500 Index. Over the last five years, the weight of the sector peaked at 7.6% at the end of 2016. Since then, there has been a steady decrease in the sector weight. The sector closed 2019 with a weight of 4.3%.

Why the decline?
In 2018, the United States took the lead in oil production. This increased supply of the commodity has led to pricing pressures for producers. The days of $100 per barrel prices for crude may be behind us. Barring any major geopolitical shocks, the expectation is for pricing to stay below $100/barrel for the foreseeable future. Increased U.S. supply has also diminished the influence the Organization of the Petroleum Exporting Countries (OPEC) has historically had in regard to global oil prices. In times of decreasing barrel prices, OPEC has cut production to increase price. The United States does not have to follow OPEC rules since it is not an OPEC member.
Another contributing factor has been the penchant of some OPEC countries to cheat the production cuts. It is an openly known secret that OPEC countries don’t always fully execute targeted cuts in production. The impact wasn’t as significant if large producers like Saudi Arabia and Iran followed through with their cuts. The costs of not following through on production cuts is a lot higher than it used to be. This has, again, weakened the control OPEC has historically had over pricing.
The move to alternative sources of energy has also contributed to the rough showing of the energy sector. In 2019, renewable energy outpaced coal by providing 23% of U.S. power generation. The declining cost and improved technology of renewable energy sources has led to an increase in demand. This is expected to continue. We are seeing more car companies invest in the production of electric vehicles (EVs). The improved technology and increased competition are leading to a growing number of affordable options when it comes to electric vehicles. This is not great news for the oil industry. The move to EVs will significantly impact the demand for oil.
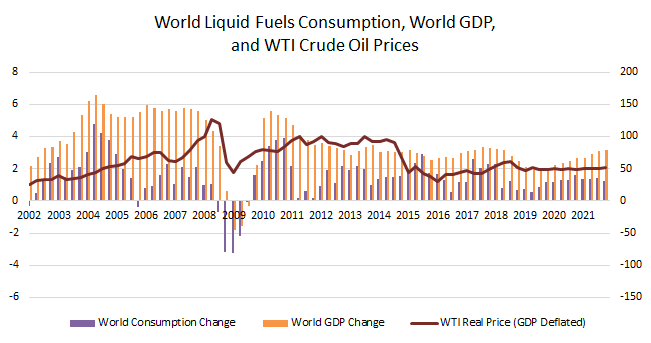
The expectation is not for the world to cease consuming oil and its related products. What we expect to see is a decrease in the growth of demand for the commodity leading to an aggregate decline in demand.
Our final chart shows the relationship between world liquid fuels consumption, world GDP change and WTI crude oil prices. It provides further validation for our outlook.
Contributed by | Kuuku Saah, CFA, Managing Director
Kuuku is a Managing Director at BTC Capital Management with nine years of investment management experience. Kuuku’s primary responsibilities include portfolio management and analysis. Kuuku attended Drake University and double-majored in finance and economics. He is a holder of the right to use the Chartered Financial Analyst® designation.
Source: BTC Capital Management, Bloomberg LP, Ibbotson Associates, FactSet.
The information provided has been obtained from sources deemed reliable, but BTC Capital Management and its affiliates cannot guarantee accuracy. Past performance is not a guarantee of future returns. Performance over periods exceeding 12 months has been annualized.
The information within this document is for information purposes only and is not intended as an offer or solicitation with respect to the purchase or sale of any security. Statements in this report are based on the views of BTC Capital Management and on information available at the time this report was prepared. Rates are subject to change based on market and/or other conditions without notice. This commentary contains no investment recommendations and you should not interpret the statement in this report as investment, tax, legal, and/or financial planning advice. All investments involved risk, including the possible loss of principal. Investments are not FDIC insured and may lose value.