
Welcome to Five in Five, a monthly publication from the Investment Team at BTC Capital Management. Each month we share graphs around five topics that illustrate the current state of the markets, with brief commentary that can be absorbed in five minutes or less. We hope you find this high-level commentary to be beneficial and complementary to Weekly Insight and Investment Insight.
This month’s Five in Five covers the following topics:
1. Consumer Sentiment
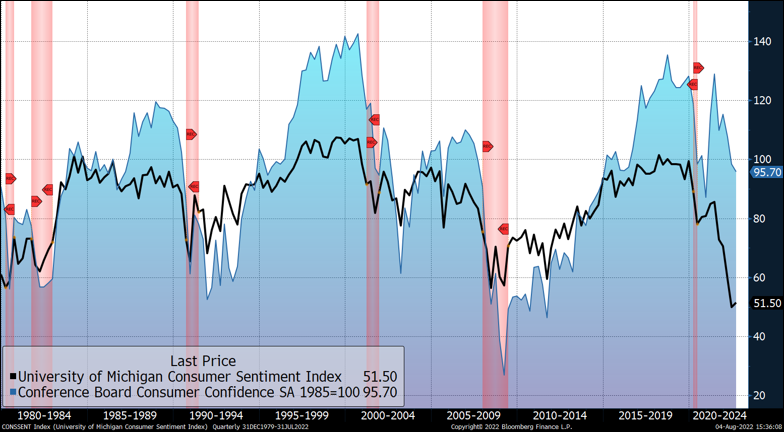
- Recent declines of both the Michigan Consumer Sentiment and Conference Board’s Consumer Confidence are charted above.
- The Michigan Sentiment Index rose to 51.5 in July slightly higher than last month’s record low.
- Softening perceptions of the job market and deteriorating income outlook have sent consumer confidence lower.
- Increasing recession chatter contributed to weaker buying plans across homes, autos and major appliances.
- Respondents continue to expect long-term inflation above 5%, a more alarming figure when compared to the 2.9% average predicted by the two-year U.S. Treasury Breakeven, a measure of expected inflation during the next two years.
2. ISM Data
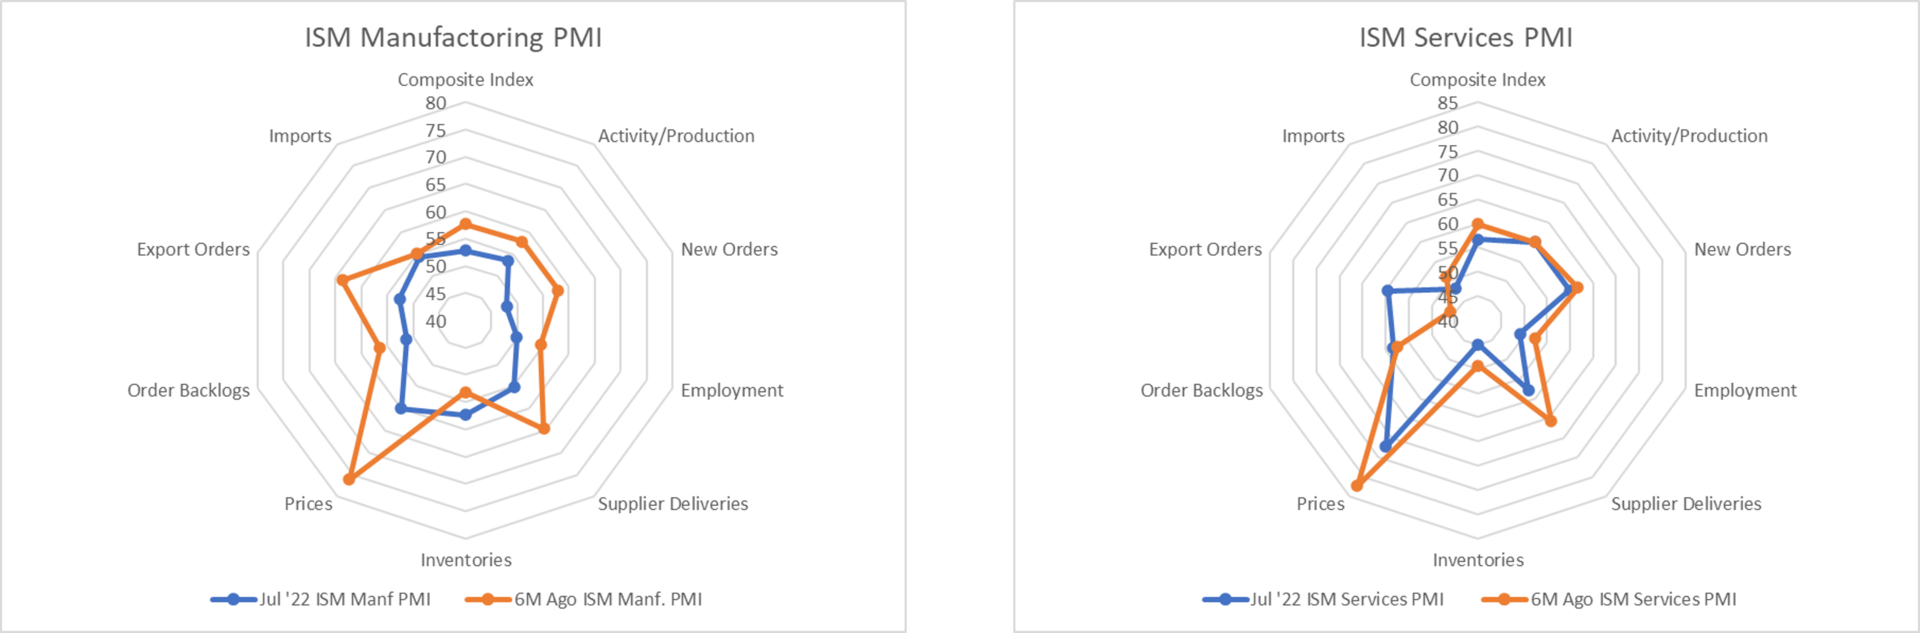
- The above charts show the contrast between the Services and Manufacturing sectors in 2022.
- The ISM Manufacturing Sector Purchasing Managers’ Index data shows contraction of most of its components except for inventories (supply build-up) and import activity (strong dollar influence).
- The slower contraction of ISM Services reflects the shift in demand from durable goods to services in 2022.
- Employment figures for both manufacturing (49.9) and services (49.1) show that employment growth has stalled.
- While the purchasing managers’ view is that prices will continue to rise, they anticipate at a slower rate.
3. Transitory After All?
- The 30-year implied inflation rate is at just 2.2%.
- This never broke out, signifying the bond market was always in the transitory camp.
- Recent Federal Reserve commitment to reduce inflation has brought this down from near-term peaks.
- The term premium on long Treasuries continues to fall with little worry about secular inflation.
- The market is pricing in a 50 or 75 basis point hike at the September meeting.
4. Equity Risk Premium
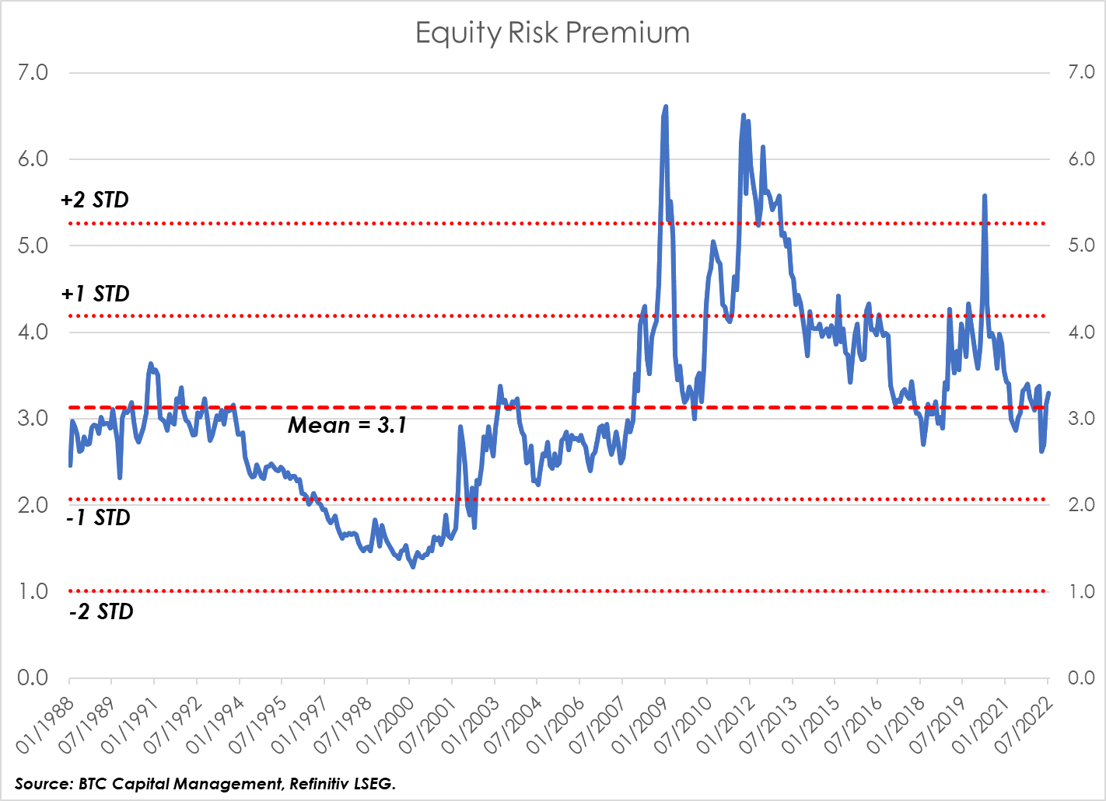
- The Equity Risk Premium (ERP) is an indication of the implied return expected for investing in equities (relatively higher risk) versus investing in securities with a perceived lower level of risk (e.g. bonds).
- This measure can be an indicator of prospective volatility and downside risk (an ERP meaningfully below its mean, for instance) or opportunity (an ERP meaningfully above its mean). The chart above presents the ERP, its mean two measures of standard deviations (STD) from its mean (+/-1 and +/-2).
- Looking back to the late 1990s, investors appeared to have become complacent as indicated by an ERP below its mean and exceeding -1 STD. In a similar vein, one may reference the below-mean ERP of 2006 – 2007 preceding the Great Financial Crisis (GFC).
- While the ERP may have indicated opportunity post-GFC, accommodative monetary policy supplemented the subsequent rally in equities.
- Currently the ERP may indicate a neutral stance concerning equities.
5. Fed Model-Equity Valuation
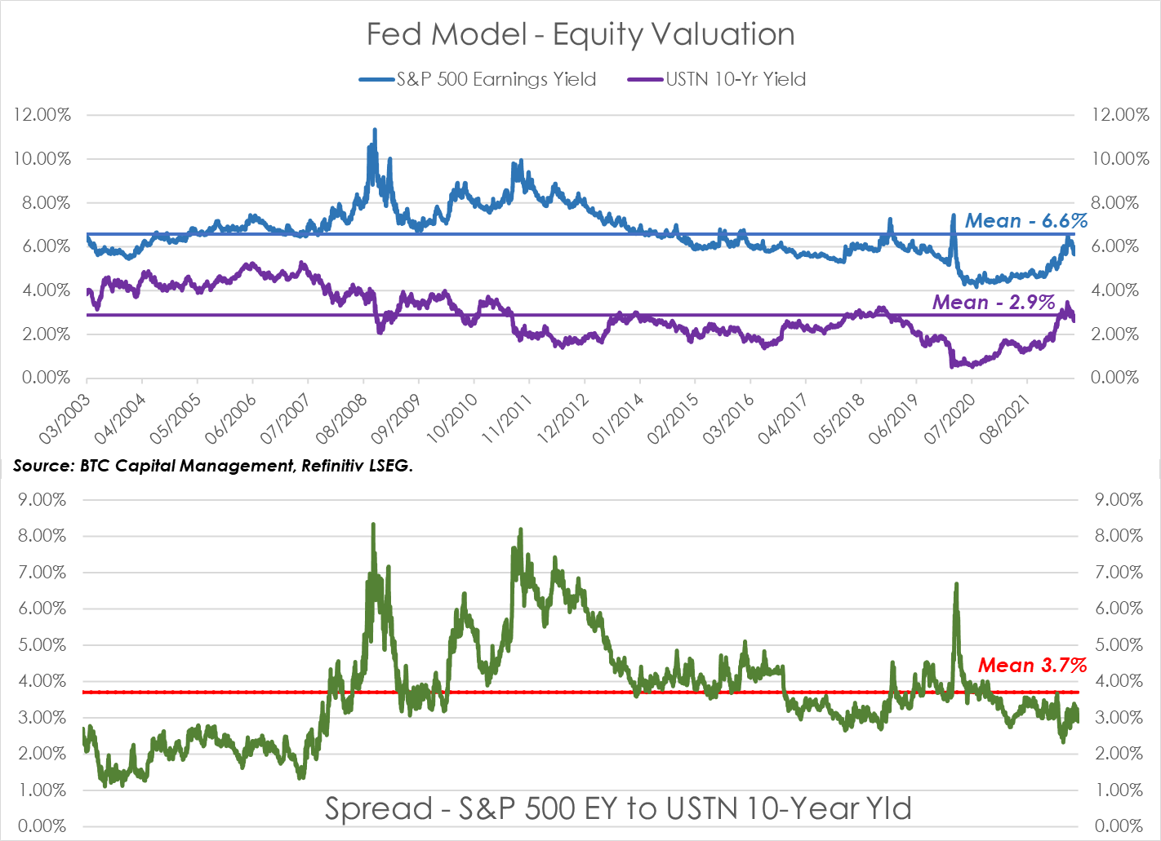
- The Fed Model is a measurement of relative valuation. It considers the earnings yield (EY) of the S&P 500, which is the reciprocal of the forward 12-month price-to-earnings ratio (P/E) relative to the yield on the 10-Year US Treasury (top chart).
- The spread, or ratio, of the EY to the USTN 10-year yield indicates relative value, based on this measure (bottom chart).
- EY may, at times, move inversely to the 10-year yield. During these times equities have provided relative performance over bonds. Recall that post-GFC, an accommodative monetary policy supplemented the rally in domestic equities.
- Currently the EY is below its 20-year historical average. The compression in P/E coincident with a downward trend in analyst earnings revisions continues to impact this measure.
- The rise in the 10-year yield YTD and the reduction in EY have resulted in the spread currently below its historical average.
Source: BTC Capital Management, Bloomberg Finance L.P., Refinitiv Datastream, FactSet
The information provided has been obtained from sources deemed reliable, but BTC Capital Management and its affiliates cannot guarantee accuracy. Past performance is not a guarantee of future returns. Performance over periods exceeding 12 months has been annualized.
This document is intended for informational purposes only and is not an offer or solicitation with respect to the purchase or sale of any security. Statements in this report are based on the views of BTC Capital Management and on information available at the time this report was prepared. Rates are subject to change based on market and/or other conditions without notice. This commentary contains no investment recommendations and you should not interpret the statement in this report as investment, tax, legal, and/or financial planning advice. All investments involve risk, including the possible loss of principal. Investments are not FDIC insured and may lose value.