
Welcome to Five in Five, a monthly publication from the Investment Team at BTC Capital Management. Each month we share graphs around five topics that illustrate the current state of the markets, with brief commentary that can be absorbed in five minutes or less. We hope you find this high-level commentary to be beneficial and complementary to Weekly Insight and Investment Insight.
This month’s Five in Five covers the following topics:
- Corporate Bonds Offering More Interest Rate Protection
- U.S. Mortgage Loan Applications for Purchase
- S&P 500 Stocks Beating the Index
- The Magnificent Seven Stocks
- A Look at Equity Valuation
1. Corporate Bonds Offering More Interest Rate Protection
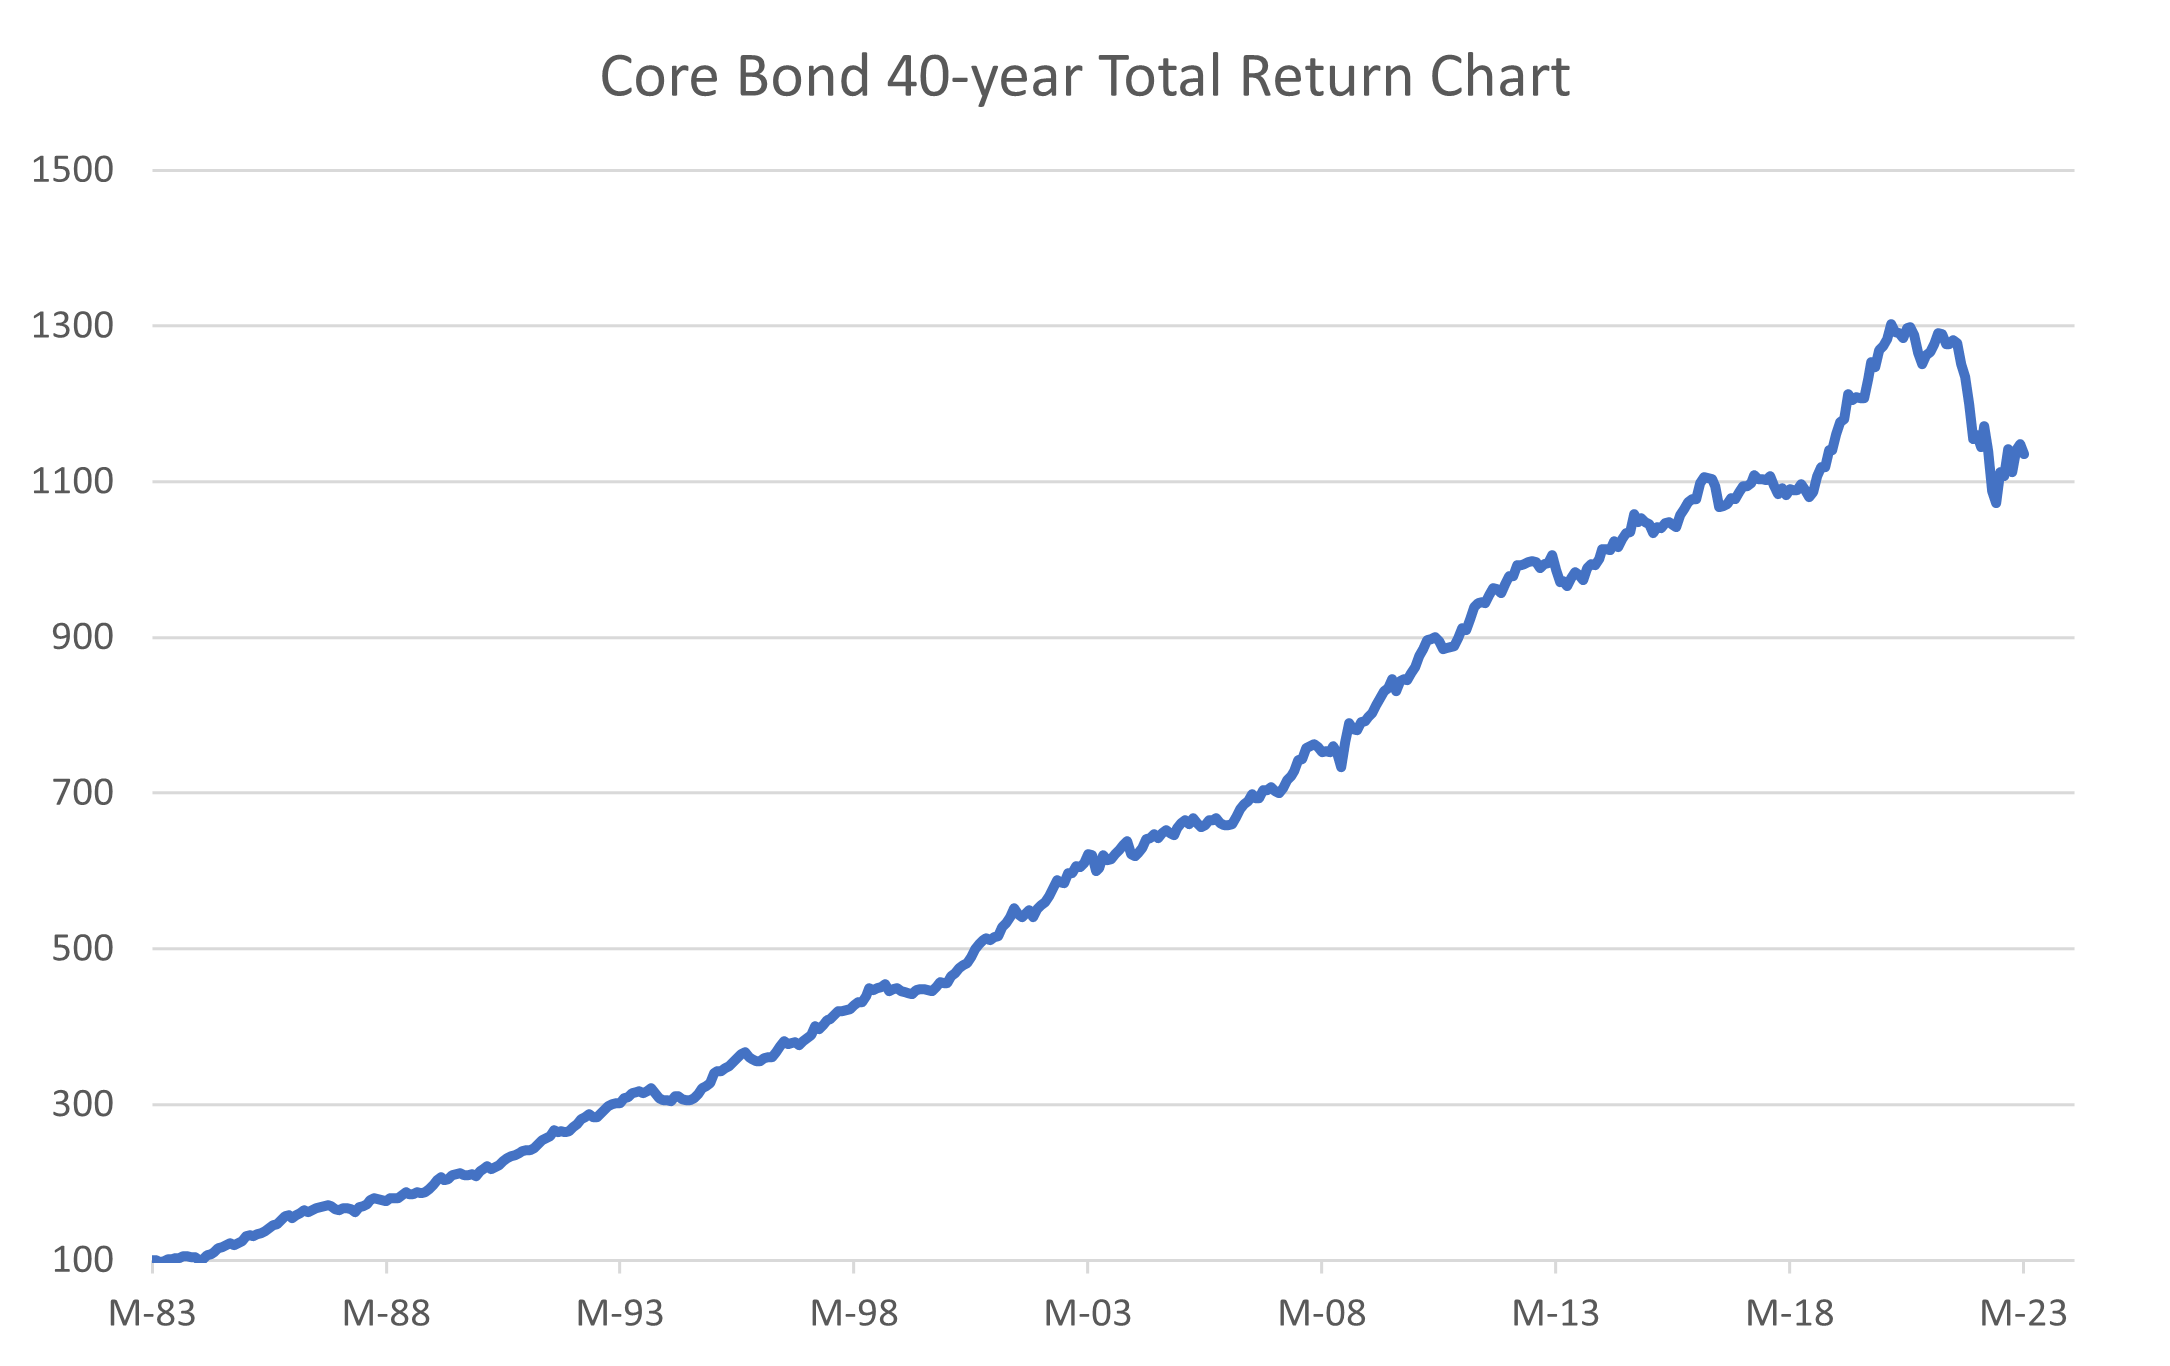
- Core Bond Total Return has returned 1035% over the last 40 years.
- This equates to 6.26% per year.
- Rolling 60-month returns were negative in 2022 for the first time in more than 40 years.
- Rolling 60-month returns have now been positive for seven consecutive months.
- Corporate bonds have returned 1411% for a compound annual growth rate of 7.02% over the same time span.
2. U.S. Mortgage Loan Applications for Purchase
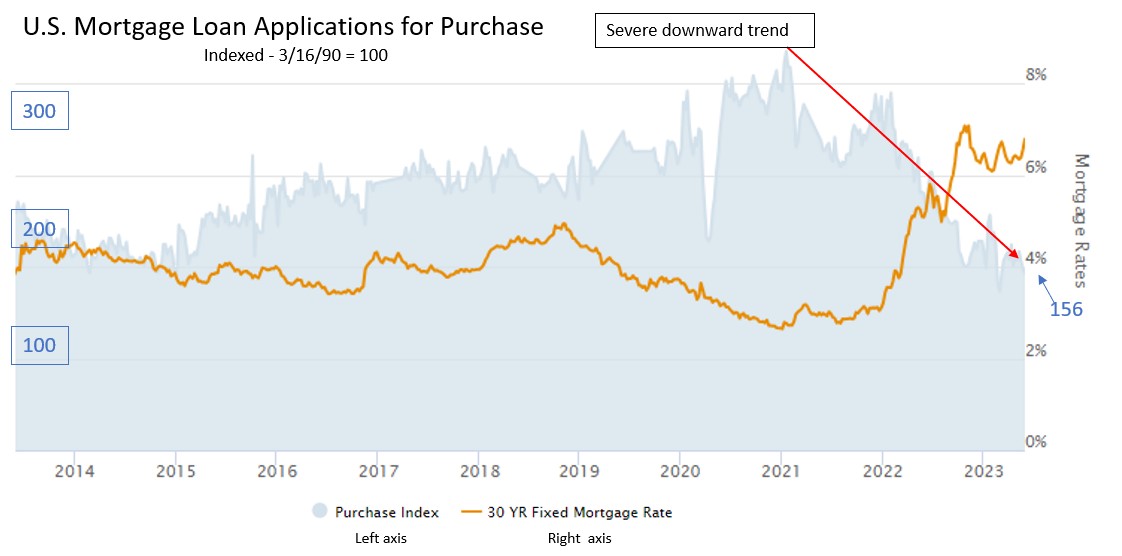
- Mortgage applications (blue shaded line) are at multi-year lows with current housing market challenges including stricter lending practices and lack of supply as existing homeowners are hesitant to relinquish their relatively low-rate mortgages.
- Mortgage rates (gold line) are at multi-year highs and have significantly increased since 2022.
- Rates are expected to remain relatively high while inflation remains a concern for the Federal Reserve and will continue to negatively impact the number of mortgage applications.
3. S&P 500 Stocks Beating the Index
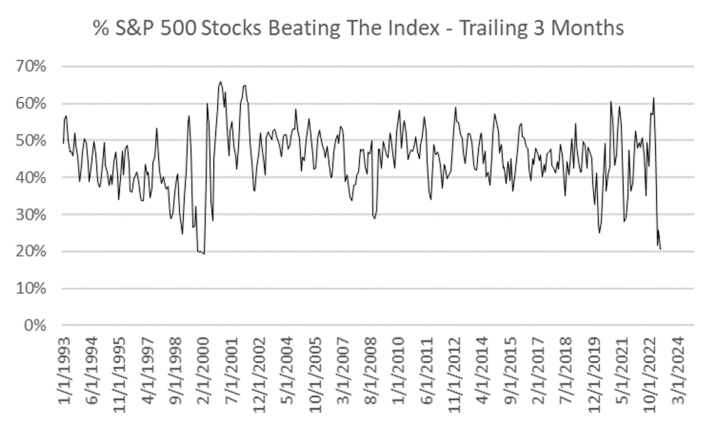
- The equity market rally year-to-date has been led by only a handful of stocks.
- Aside from the tech bubble of the early 2000’s, the S&P 500 currently has the lowest percentage of individual stocks outperforming the underlying index in the last 30 years.
- Individual/retail investors have been chasing the recent rally as fear of missing out (FOMO) appears to be the current sentiment. These investors have also been investing cash previously on the sidelines into the technology sector.
4. The Magnificent Seven Stocks
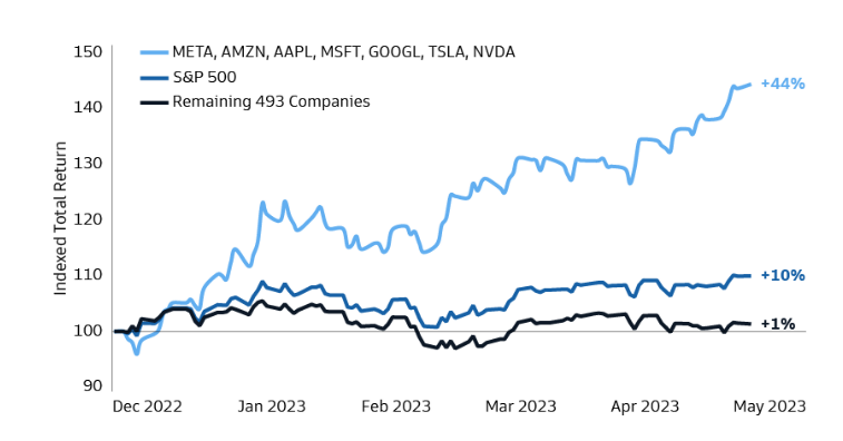
- As noted, the market’s rally has essentially been limited to a handful of stocks. The “Magnificent Seven” mega-cap tech stocks (META, AMZN, AAPL, MSFT, GOOGL, TSLA, NVDA) have rallied significantly whereas the remaining 493 stocks have only eked out a small positive return year-to-date.
- A potential rise in interest rates or a downturn in the economy may have an adverse effect on the Magnificent Seven and thusly have a disproportional impact on the overall index to the downside.
5. A Look at Equity Valuation
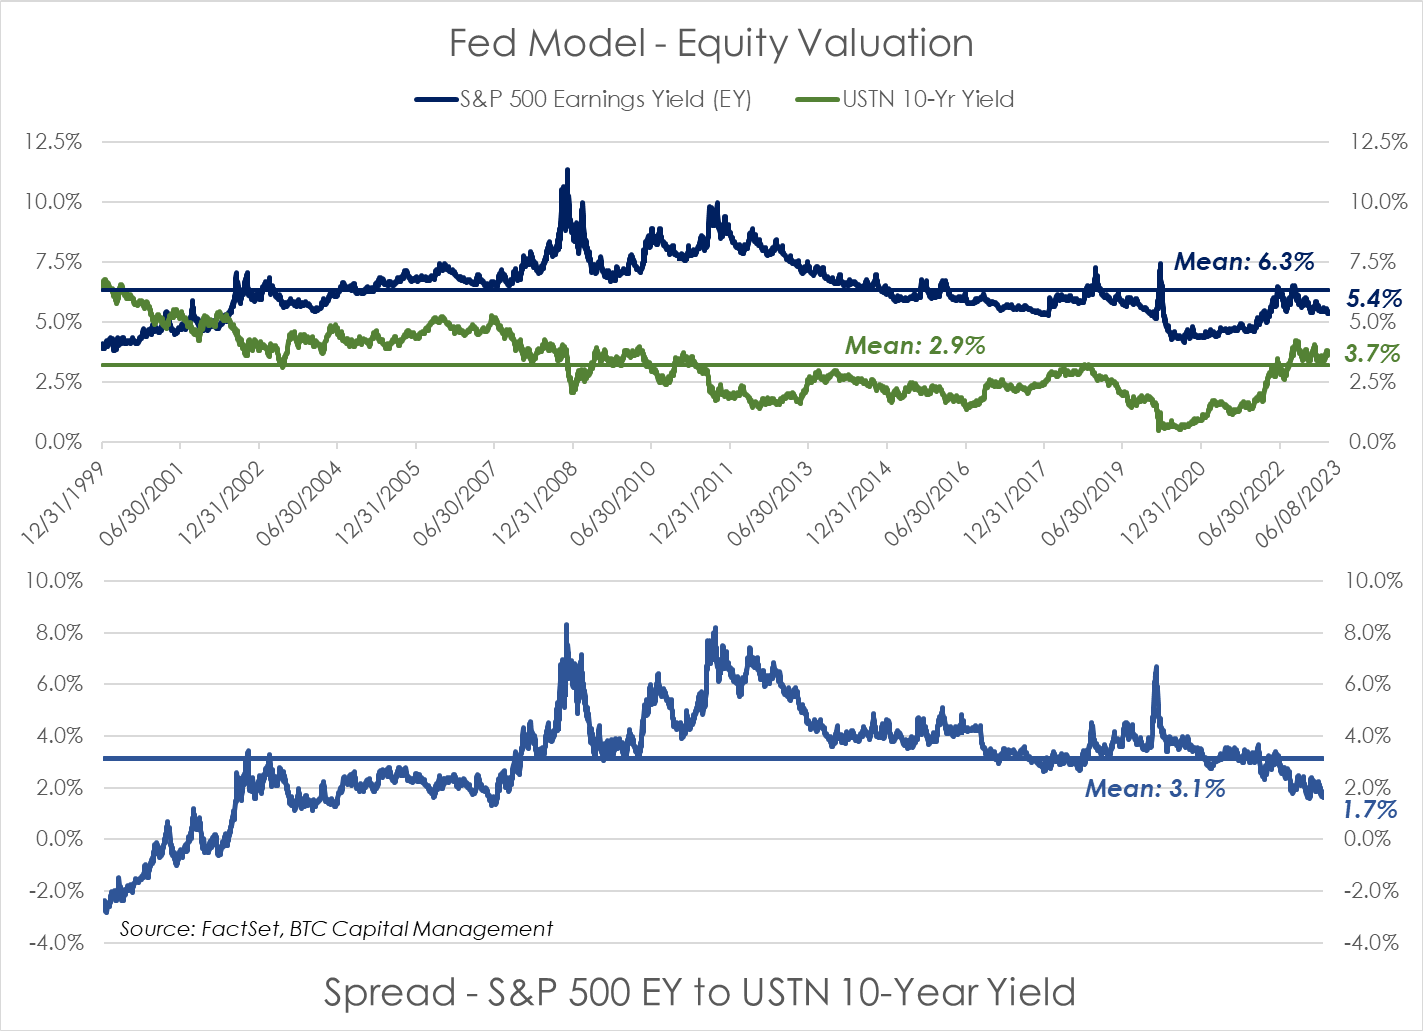
- The Fed Model (top chart) is a measure of relative valuation. It considers the earnings yield (EY) of the S&P 500, which is the reciprocal of the forward twelve-month price-to-earnings ratio (P/E) relative to the yield on the 10-year US Treasury (10-Yr).
- The spread, or ratio, of the EY to the USTN 10-year yield indicates relative value, based on this measure (bottom chart).
- Currently the EY (5.4%) is below its 20-year historical average (6.3%), primarily due to the downward trend in analyst estimates of year-over-year (YOY) earnings growth coupled with the rise in equity valuations. The rise in the 10-year yield (3.7%) and the reduction in EY have resulted in the reduction in the spread to 1.7%, which is currently below its historical average (3.1%).
- A similar period where EY, the yield of the 10-year and the spread was observed in 2003:
- Interest rates were range bound and the USTN 10-year ended the year yielding 4.01%.
- The subsequent returns for the S&P 500 six-months: 14.2%; 1-Year: +18.1%; 2-Years: +12.1%. Most of the subsequent returns were captured in the first six-months.
- In 2003, a large driver to equity returns was the double-digit growth in earnings approximating 76.7% YOY in 2003, which followed 11.8% for 2002. Currently analysts project earnings to grow YOY by 1.8% for 2023 and 11.8% for 2024.
- Note the P/E trailing twelve months (TTM) and next twelve months (NTM) at that time was 19.5x & 17.1x, respectively. Currently the S&P 500 trades at a P/E TTM of 21.1x and NTM of 18.8x.
The information provided has been obtained from sources deemed reliable, but BTC Capital Management and its affiliates cannot guarantee accuracy. Past performance is not a guarantee of future returns. Performance over periods exceeding 12 months has been annualized.
This document is intended for informational purposes only and is not an offer or solicitation with respect to the purchase or sale of any security. Statements in this report are based on the views of BTC Capital Management and on information available at the time this report was prepared. Rates are subject to change based on market and/or other conditions without notice. This commentary contains no investment recommendations and you should not interpret the statement in this report as investment, tax, legal, and/or financial planning advice. All investments involve risk, including the possible loss of principal. Investments are not FDIC insured and may lose value.