
Welcome to Five in Five, a monthly publication from the Investment Team at BTC Capital Management. Each month we share graphs around five topics that illustrate the current state of the markets, with brief commentary that can be absorbed in five minutes or less. We hope you find this high-level commentary to be beneficial and complementary to Weekly Insight and Investment Insight.
This month’s Five in Five covers the following topics:
- Yields Moving Higher
- High Beta as a Factor vs. S&P 500
- Low Volatility as a Factor vs. S&P 500
- Individual Investor Sentiment
- Corporate Sentiment
1. Yields Moving Higher
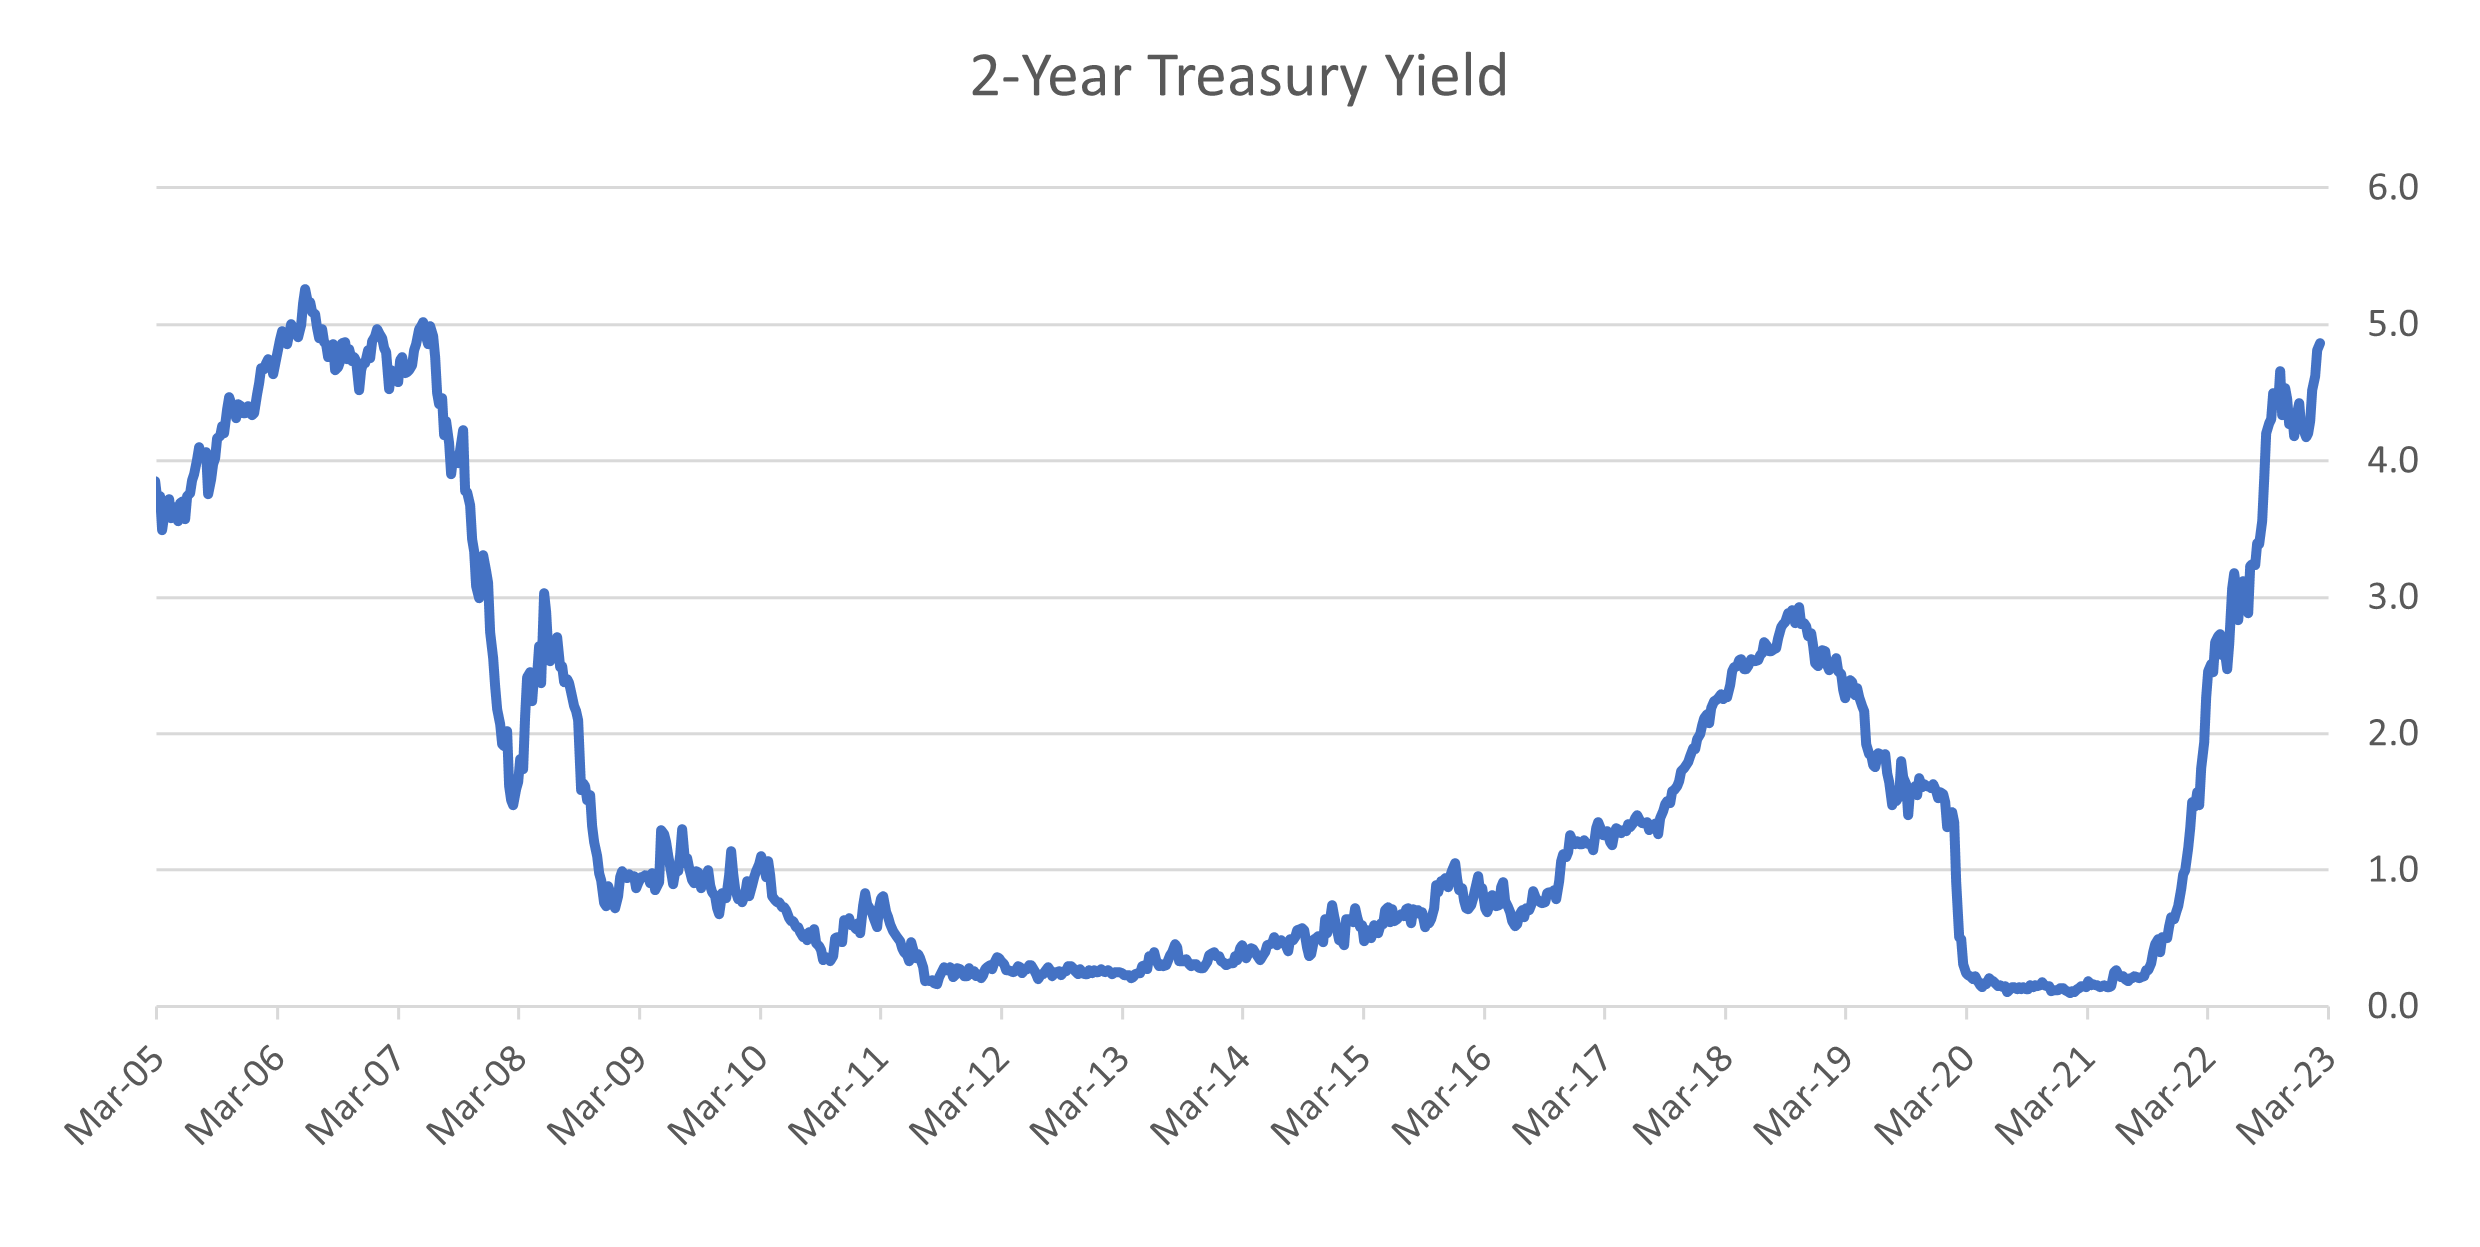
- 2-Year Treasury yields hit a 15-year high in February.
- The market is pricing in a higher for longer trajectory.
- The market is pricing in a peak 2023 rate of 5.45%, which would exceed the 2006 peak of 5.27%.
- Inflation expectations have also shot up this year as the last Consumer Price Index report remained hotter than expected.
- Higher yields globally have continued to pull U.S. rates higher.
2. High Beta as a Factor vs. S&P 500
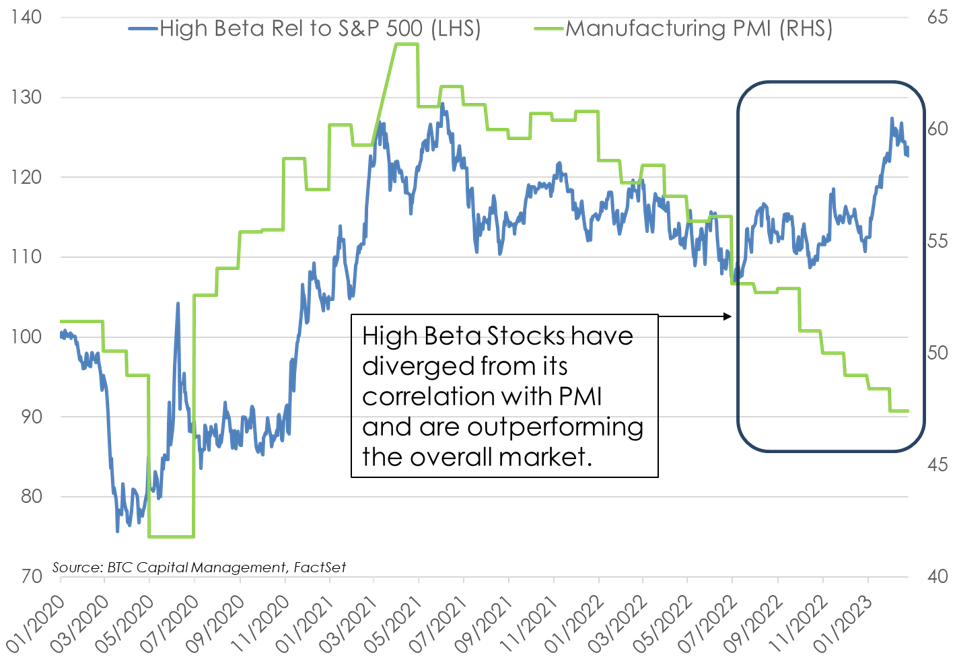
- Factor investing, or targeting what appears to be definable catalysts of performance, have been popularized over the last 20 years.
- Since the summer of 2022, stocks have seen a divergence between their relationship with U.S. manufacturing activity (U.S. Purchasing Managers’ Index) and performance.
- High Beta stocks have outperformed the overall market in the last several months despite decreasing domestic manufacturing activity.
- Since Sept. 30, 2022, High Beta (as a factor or catalyst of return) has outperformed the broader equity market as exhibited in the relative performance of the Invesco S&P 500 High Beta ETF, which has materially outperformed the S&P 500 (+22.5% vs. +10.7%; price change only).
- This is somewhat of an anomaly as, over the last 20 years, the S&P 500 has outperformed High Beta (+9.7% vs. +9.5% when considering the annualized price return).
3. Low Volatility as a Factor vs. S&P 500
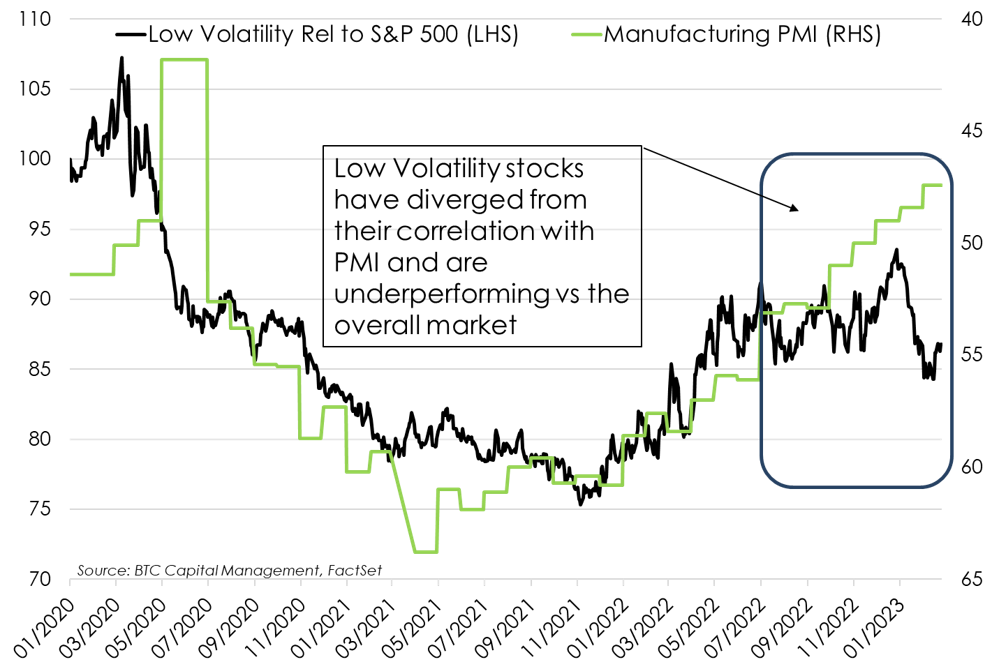
- Similarly, Low Volatility, as a factor or catalyst of return, has underperformed the broader equity market since the second half of 2022 despite its previous correlation with manufacturing activity.
- Since Sept. 30, 2022, Low Volatility has lagged the broader equity market as exhibited in the relative performance of the Invesco S&P 500 Low Volatility ETF, which has materially underperformed the S&P 500 (+7.7% vs. +10.7%; price change only).
- While the performance of Low Volatility and the S&P 500 exhibited a high correlation, this relationship broke in 2022 at which time the S&P 500 materially outpaced Low Volatility.
- Investors are concerned that this recent rotation into cyclical stocks and out of defensive stocks may be a catalyst for an eventual correction should the U.S. manufacturing activity continue to falter.
4. Individual Investor Sentiment
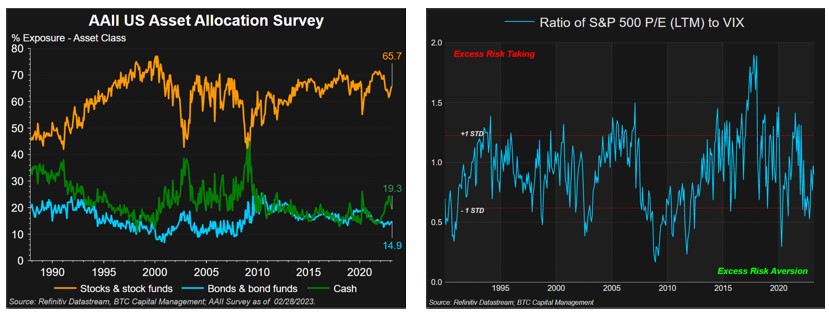
- While it appears a risk-on environment has pervaded year-to-date in 2023, concerns arise as to sustainability of this quick uptick to start the year.
- The left-hand chart presents the American Association of Individual Investors (AAII) US Investor Asset Allocation survey as of 02/28/2023 and exhibits that individual investors continue to have an appetite for equities as indicated by the following exposures:
-
- 65.7% equities
- 14.9% fixed income
- 19.3% cash
-
- An indicator of risk-sentiment is the ratio of the S&P 500 Price-to-Earnings last twelve months (P/E LTM) ratio to the CBOE Volatility Index (VIX) – note the right-hand chart.Investors have been taking more risk, as exhibited in both their allocation to equities and recent uptick in the ratio of the S&P 500 P/E LTM to the VIX Index:
-
- S&P 500 P/E LTM: 19.4x
- VIX: 18.9
-
-
5. Corporate Sentiment
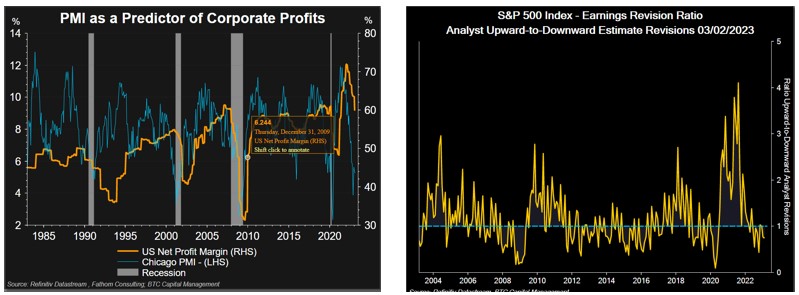
- The Purchasing Managers’ Index (PMI) may be seen as a leading indicator of corporate profitability. Note that a reading above 50 indicates expansion while a reading below 50 indicates contraction. PMIs continue below 50, indicating contraction.
- The left-hand chart compares the Chicago PMI to net profits reported for U.S. companies. As corporate profitability correlates with PMIs the trend in profitability appears to track PMIs, which have declined from highs observed in February 2022.
- The downtrend in corporate profitability has also been reflected in the downward revisions to corporate earnings by analysts. While analyst downward revisions continue, the rate of change and breadth appear to have slowed.
- Analysts project growth in both revenue and earnings-per-share for companies comprising the MSCI USA Index for calendar-year 2023:
-
- Revenues: +1.5%
- Earnings: +2.0%
-
- Similarly, analysts project growth in both revenue and earnings-per-share for companies comprising the MSCI ACWI x-USA for calendar-year 2023:
-
- Revenues: +1.4%
- Earnings: +1.9%
-
The information provided has been obtained from sources deemed reliable, but BTC Capital Management and its affiliates cannot guarantee accuracy. Past performance is not a guarantee of future returns. Performance over periods exceeding 12 months has been annualized.
This document is intended for informational purposes only and is not an offer or solicitation with respect to the purchase or sale of any security. Statements in this report are based on the views of BTC Capital Management and on information available at the time this report was prepared. Rates are subject to change based on market and/or other conditions without notice. This commentary contains no investment recommendations and you should not interpret the statement in this report as investment, tax, legal, and/or financial planning advice. All investments involve risk, including the possible loss of principal. Investments are not FDIC insured and may lose value.