
Welcome to Five in Five, a monthly publication from the Investment Team at BTC Capital Management. Each month we share graphs around five topics that illustrate the current state of the markets, with brief commentary that can be absorbed in five minutes or less. We hope you find this high-level commentary to be beneficial and complementary to Weekly Insight and Investment Insight.
This month’s Five in Five covers the following topics:
- Gap Between Real GDP and Real GDI
- Analyst Estimated Growth of S&P 500 Earnings
- Price-to-Earnings Ratio – Next Twelve Months
- Real Yields Surge Again
- Reason to Hold Bonds: Unrealized Losses are Temporary
1. Gap Between Real GDP and Real GDI
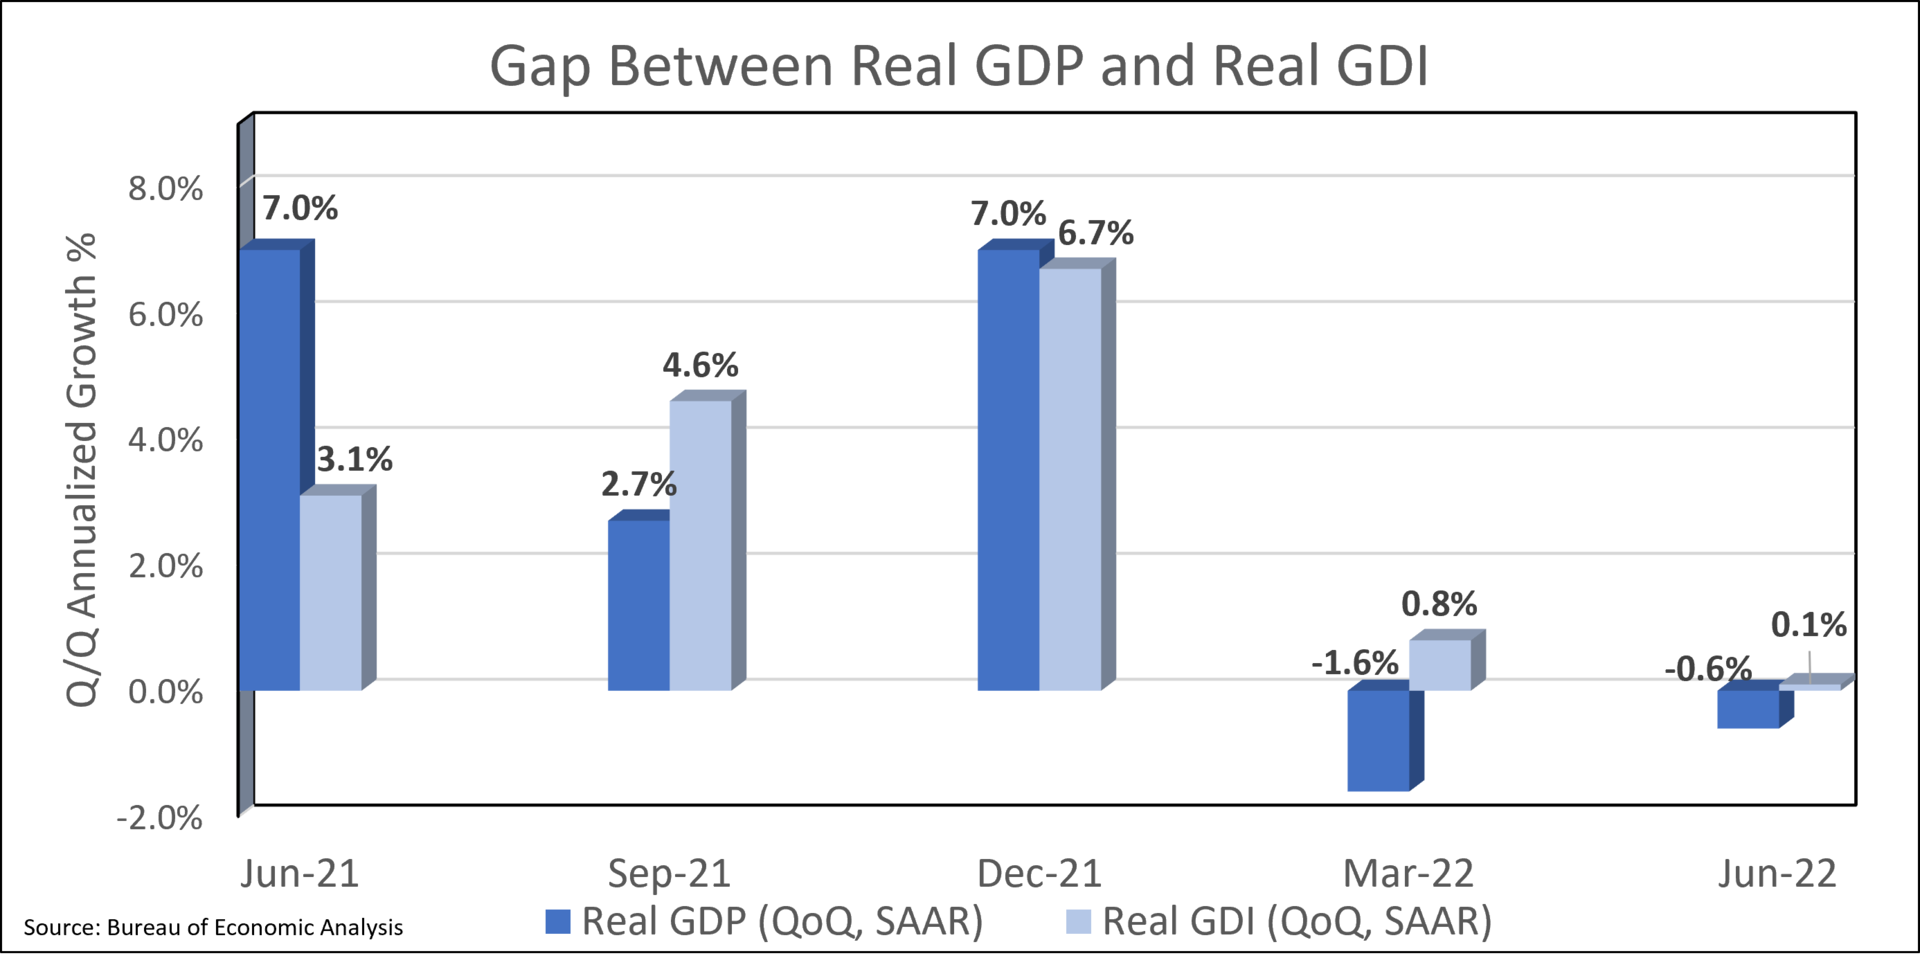
- While Gross Domestic Product (GDP) has registered negative results for the first two quarters of 2022, Gross Domestic Income (GDI) has been positive for those periods.
- The positive results for GDI add support to the stance that the U.S. economy is not currently in recession despite the two consecutive quarters of negative GDP readings.
- To distinguish between the two, GDP is a measure of what an economy produces while GDI is a measure determined by what an economy receives (wages, profits, interest payments, etc.).
- As depicted in the graph, disparity between the two measures is not unusual as different data sources are used to derive their respective levels.
2. Analyst Estimated Growth of S&P 500 Earnings
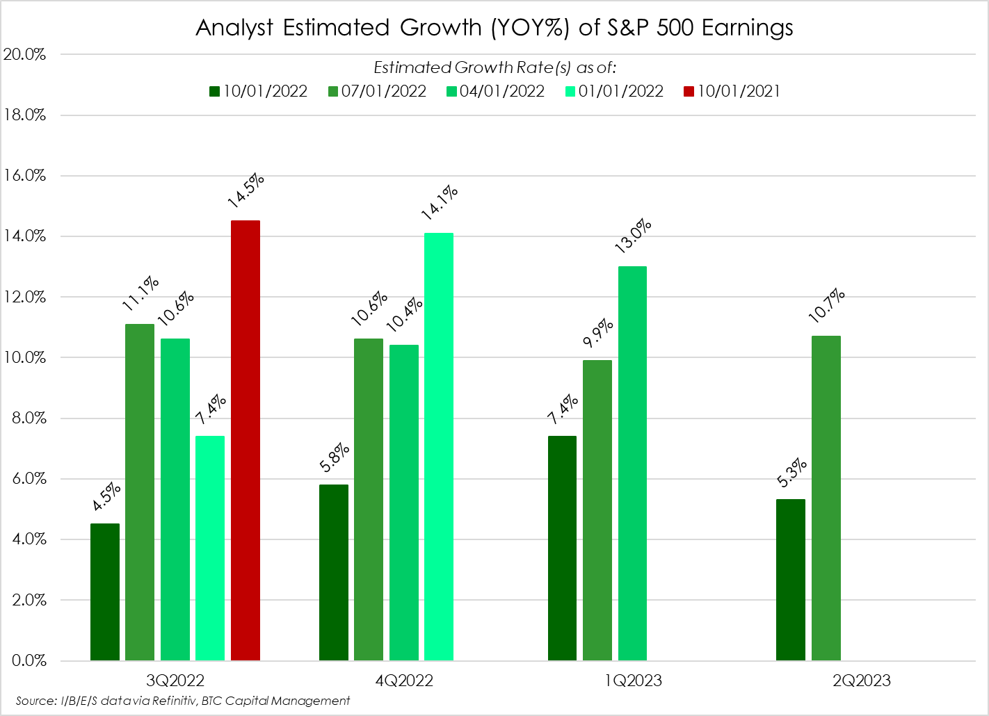
- Earnings remain front-of-mind to equity investors. Analyst revisions have trended downward; will that trend remain and what is the terminal estimate of forward growth of earnings by analysts?
- Using I/B/E/S data from Refinitiv, we exhibit the impact of analyst downward revisions on the rate of change of forward earnings growth.
- Analysts were optimistic as reflected in their projected growth in earnings for 3Q2022, 4Q2022 and 1Q2023.
- For 3Q2022, downward revisions have more than halved the project growth in earnings to 4.5% year-over-year from 11.1% as recently as 07/01/2022.
- A similar trend has also impacted 4Q2022 and 1Q2023 projected growth in earnings. Early estimates for 2Q2023 also exhibit this trend.
- Note that, while this downward trend appears intact for the near-term, analysts continue to project positive earnings growth going forward.
3. Price-to-Earnings Ratio – Next Twelve Months
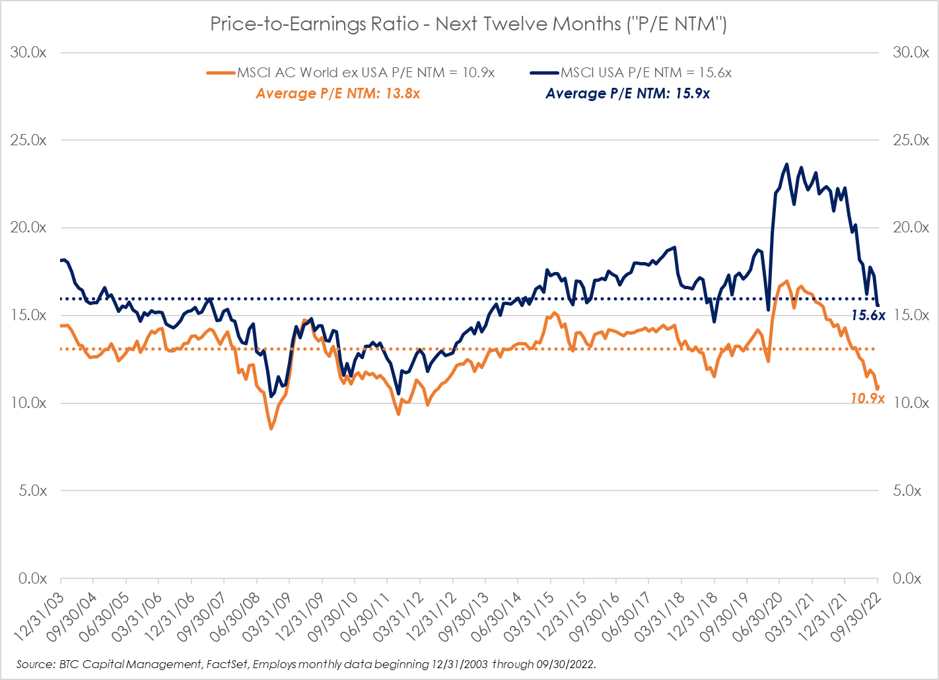
- Given the trend in revisions, coupled with the rise in interest rates, perceived Fed policy and overall investor sentiment, valuations as measured by the price-to-earnings ratio (P/E) of a company, or an equity index have come down.
- Recall that, while analysts have written down their estimates for future earnings, the question may be what are investors willing to pay for that future stream of projected earnings?
- This chart depicts the P/E based on the next twelve-months estimated earnings. A few items of note:
- Valuations, as exhibited, have come down from their lofty levels during the first-half of 2021.
- Both the MSCI USA Index (broad measure of domestic stocks) and the MSCI All-Country World Index ex-USA (broad measure of foreign stocks) have broke through their 20-year average P/E NTM.
4. Real Yields Surge Again
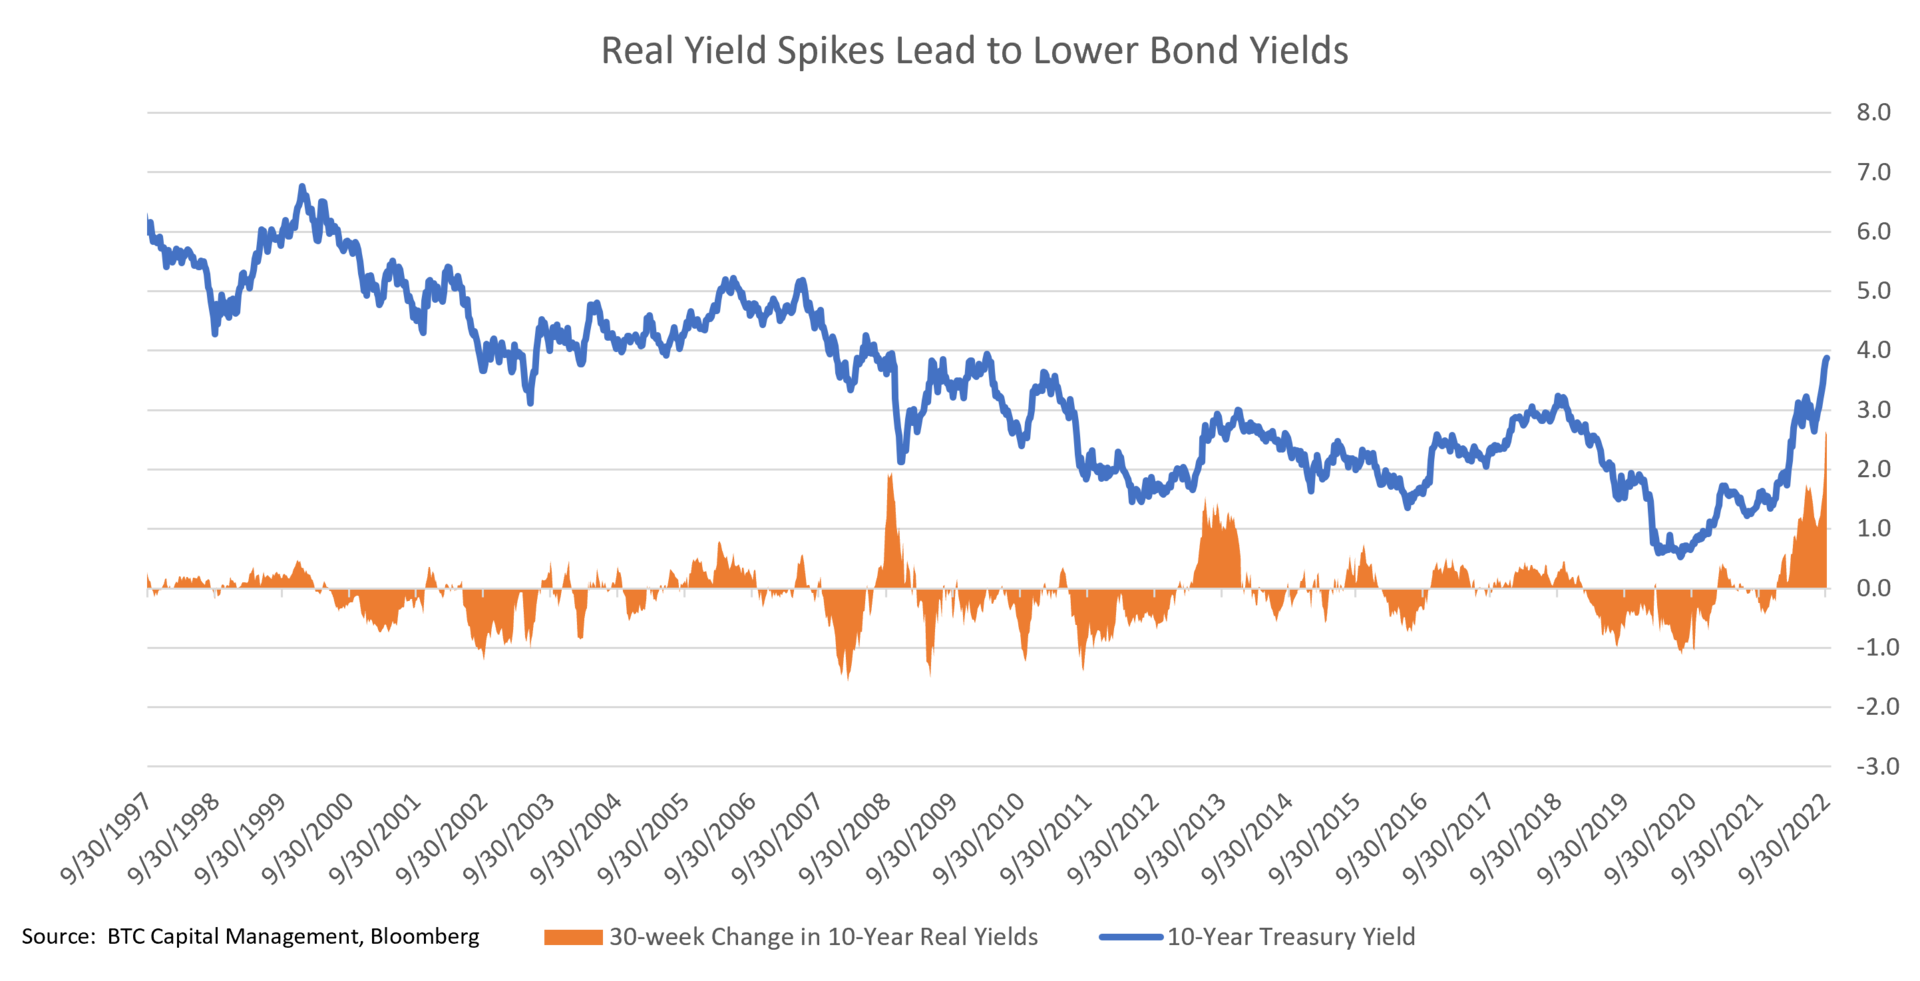
- 10-year real yields are now at a record surge over a rolling 30-week period.
- This will have a significant impact on the economy in coming quarters.
- The two previous spikes showed bond yields falling over the ensuing months.
- The Fed only started raising rates in March, but policy lags by 1-2 years.
- Set-up is favorable to owning fixed income in coming quarters.
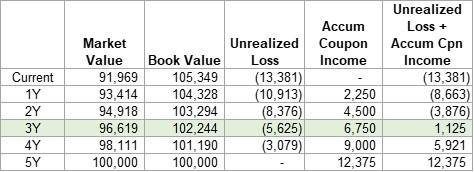
5. Reason to Hold Bonds: Unrealized Losses are Temporary
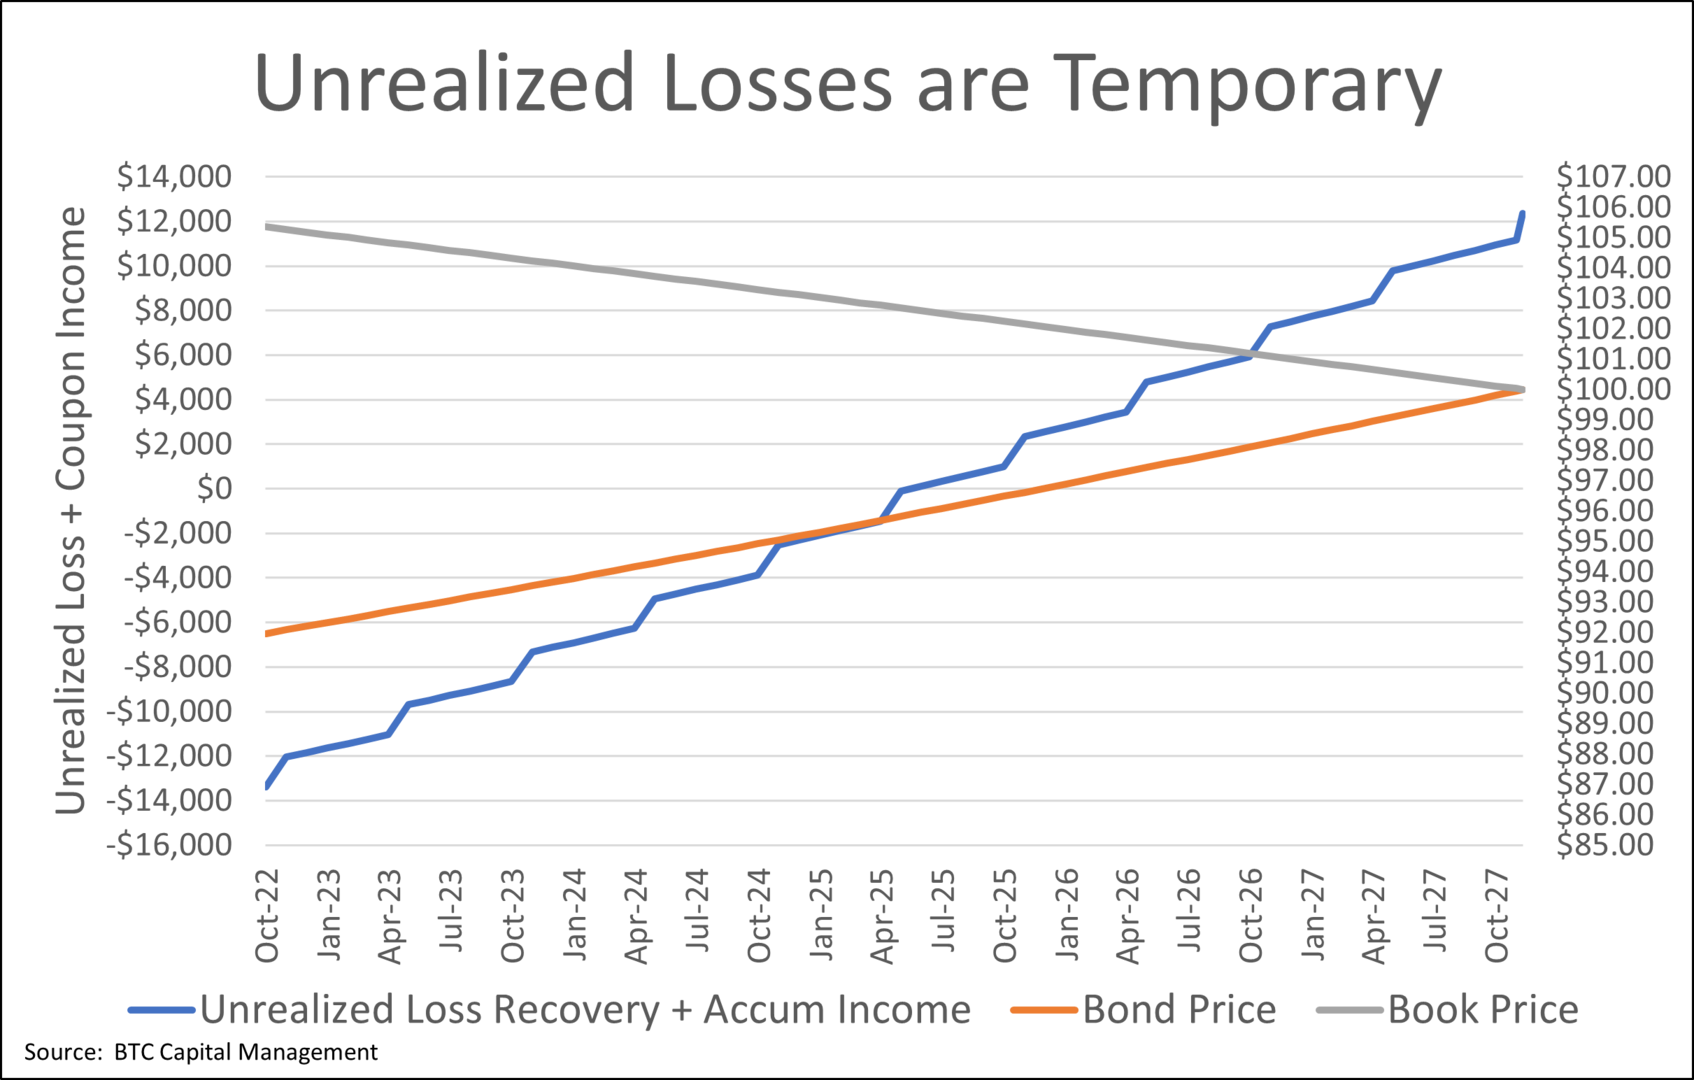
- For high quality bonds as they approach maturity the market price and the cost converge to par value $100.
- The chart and table show an example of a $100,000 5-year U.S. Treasury bond 2.25% 11/15/2027, bought a year ago when bond prices were higher. The current cost (amortized) is $105.349 but rising rates have pushed the market price to $94.969, so an unrealized loss of $13,381 would be listed on a custody statement.
- As time passes the bond’s market value (accretion) and cost (amortization) approach $100,000, eventually resulting in no loss if held to maturity.
- However, investment loss disappears much sooner. This bond pays out a coupon payment of $2,250 a year, which helps offset your loss if you happen to sell prior to maturity. When coupon payments received are added this display shows that by the end of the third year you would be $1,125 ahead on your investment if you sold the bond at that time.
- This display assumes a constant yield approach and yields remain the same.
Source: BTC Capital Management, Bloomberg Finance L.P., Refinitiv Datastream, FactSet
The information provided has been obtained from sources deemed reliable, but BTC Capital Management and its affiliates cannot guarantee accuracy. Past performance is not a guarantee of future returns. Performance over periods exceeding 12 months has been annualized.
This document is intended for informational purposes only and is not an offer or solicitation with respect to the purchase or sale of any security. Statements in this report are based on the views of BTC Capital Management and on information available at the time this report was prepared. Rates are subject to change based on market and/or other conditions without notice. This commentary contains no investment recommendations and you should not interpret the statement in this report as investment, tax, legal, and/or financial planning advice. All investments involve risk, including the possible loss of principal. Investments are not FDIC insured and may lose value.