
Welcome to Five in Five, a monthly publication from the Investment Team at BTC Capital Management. Each month we share graphs around five topics that illustrate the current state of the markets, with brief commentary that can be absorbed in five minutes or less. We hope you find this high-level commentary to be beneficial and complementary to Weekly Insight and Investment Insight.
This month’s Five in Five covers the following topics:
- U.S. Economic Sentiment Indicator vs. S&P 500
- Earnings Revision Ratio
- Higher for Longer
- AAII U.S. Asset Allocation Survey
- Ratio: S&P 500 P/E vs. CBOE Volatility Index
1. U.S. Economic Sentiment Indicator vs. S&P 500
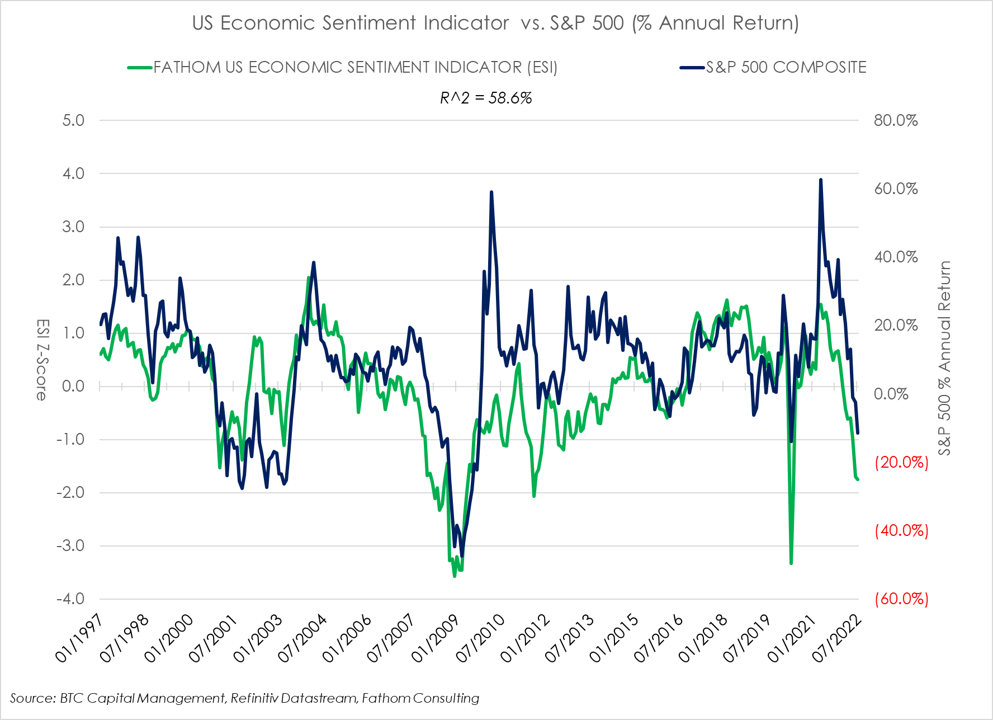
- This chart exhibits the Fathom Consulting’s Economic Sentiment Index (ESI) relative to the subsequent 12 month percentage change in the S&P 500.
- Fathom’s ESI measures economic sentiment, and employs a technique known as “principal component analysis” to distil information from numerous consumer and business surveys into a single composite indicator exhibiting economic growth.
- The Z-score for the ESI is depicted above to measure the standard deviations from the mean. A Z-score of 0 indicates the data point’s score is identical to the mean score. A Z-score of +/- 1.0 indicates a value that is one standard deviation from the mean. Scores may be positive or negative, with a positive value indicating the score is above the mean and a negative score indicating it is below the mean.
- R-squared (R^2) acknowledges the relationship of movements in the S&P 500 that may be explained by movements in the ESI.
- ESI may be considered as a leading indicator regarding next 12 month performance of the S&P 500. Subsequent annual performance of the S&P 500 tends to mimic the trend in the ESI.
2. Earnings Revision Ratio
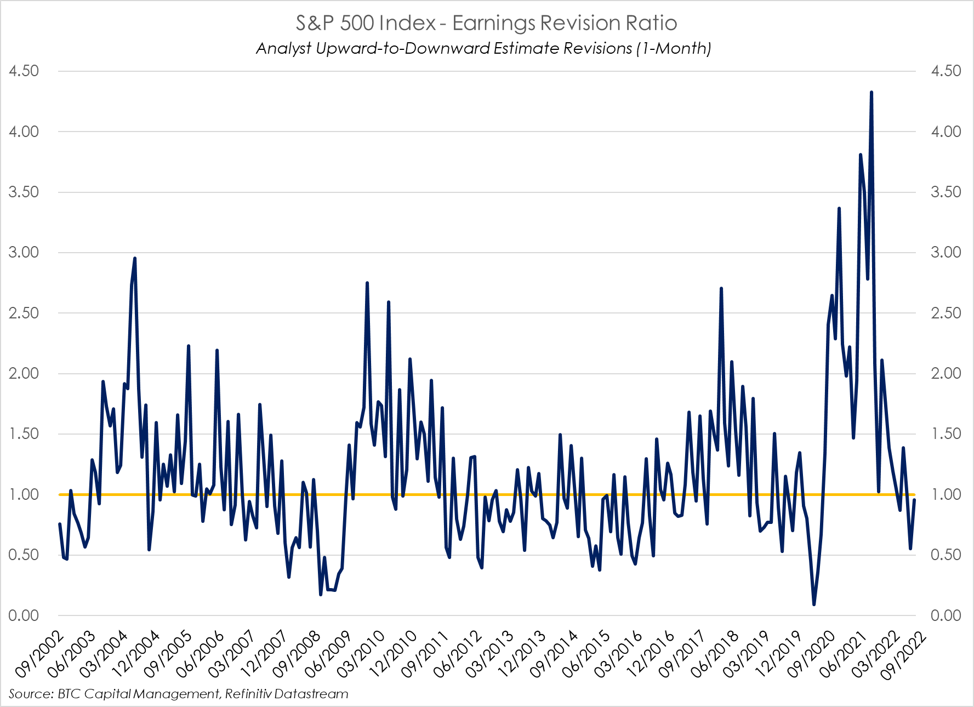
- Earnings revisions by analysts have been front of mind, specifically when attempting to ascertain expectations for valuations and overall return.
- This chart exhibits the trend in analysts’ one-month earnings revisions, which has been fluctuating throughout the first half of 2022. Analyst revisions have trended downward throughout the first half of 2022. This phenomena has continued into the current quarter and beyond.
- With the third quarter reporting season just around the corner, analysts have been active in revising their estimates. According to Refinitiv IBES, for the S&P 500 analysts are estimating year-over-year (YOY) growth in earnings for the third-quarter of 5.1%, materially below the 11.1% estimated as of the beginning of the quarter. Likewise, for the fourth quarter analysts are estimating earnings will grow 6.3% YOY versus 10.6% as of the beginning of the quarter.
- Looking out over the next 12 months, downward revisions currently outpace upward revision 62% to 38%, a trend which has been in place for much of this third quarter. The result, analysts are estimating earnings growth YOY of 7.9% for all of 2022 and 8.0% for 2024, down from 9.5% and 9.3% as of the beginning of the quarter.
3. Higher for Longer
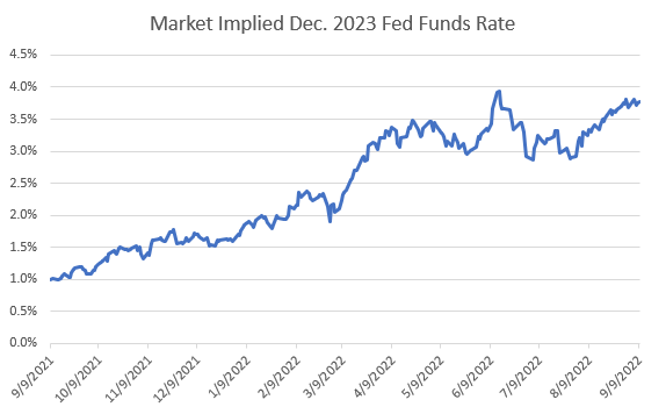
- The market is removing the concept of rate cuts in 2023.
- FOMC Chair Powell gave an extremely direct and hawkish message at Jackson Hole.
- The Fed is saying they will tolerate more economic pain to beat inflation.
- However, growing evidence shows the Fed is limited against aggressive fiscal spending.
- The global energy crisis remains unresolved, thereby keeping upward pressure on inflation.
4. AAII U.S. Asset Allocation Survey
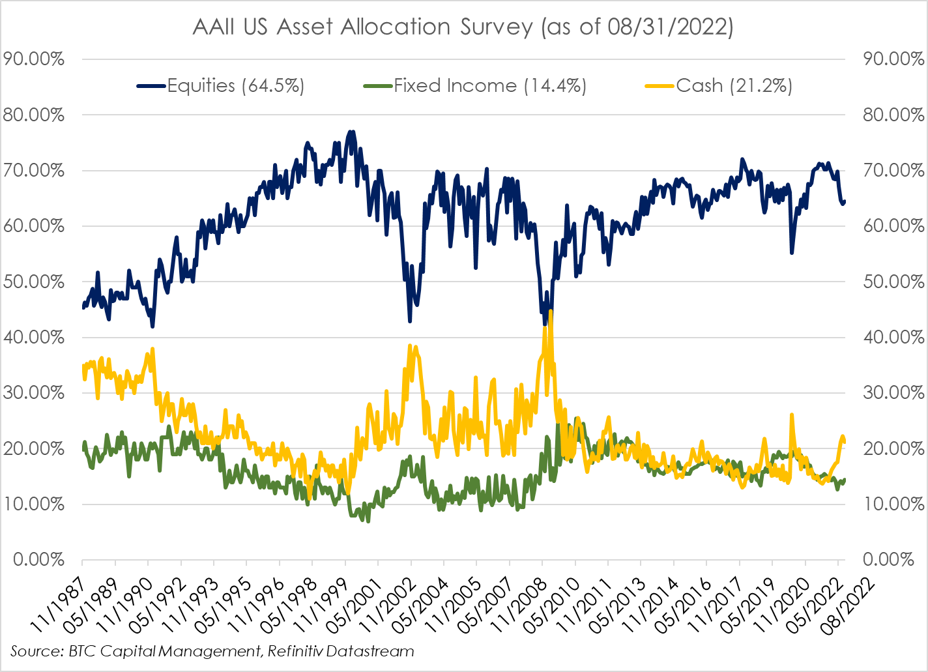
- This chart presents the American Association of Individual Investors (AAII) US Asset Allocation Survey, a monthly survey of investors.
- Investors appear to have favored cash as a means of managing risk. The allocation to cash (21.2%) began to accumulate as of the end of the second quarter. As of Dec. 31, 2021, the allocation to cash was similar, modestly higher, to that of fixed income (15.1% and 14.4%; respectively).
- Investors appear to have retained an appetite for equities as equity allocations, currently 64.5%, have remained somewhat firm since year end (70.5%). Overall, commitments to equity investments is currently above the historical average of 61.6% since November 1987.
- The allocation to fixed income has remained static since Dec. 31, 2021 (14.4%). Since November 1987, the allocation to fixed income has exhibited a range from a minimum of 6.9% to a maximum of 25.5%, with an average allocation of 15.9%.
5. Ratio: S&P 500 P/E vs. CBOE Volatility Index
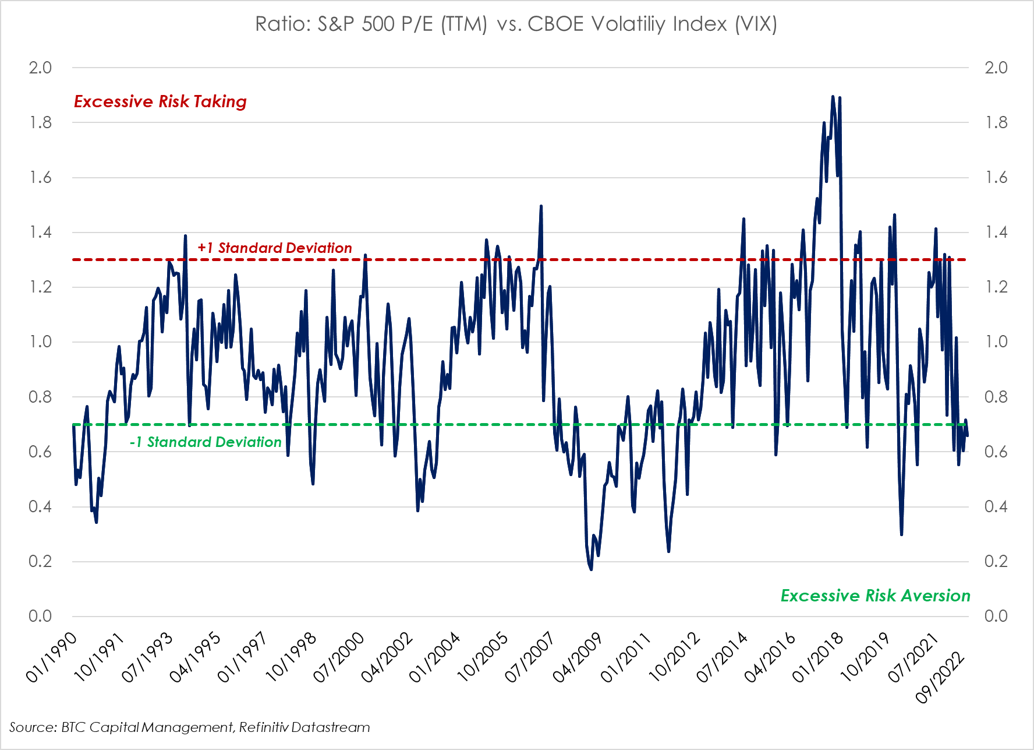
- This chart presents a ratio of the trailing 12-month price-to-earnings ratio (P/E TTM) of the S&P 500 to the CBOE Volatility Index (VIX).
- The CBOE Volatility Index (VIX) is designed to produce a measure of constant, 30-day expected volatility of the U.S. stock market, as represented by the S&P 500.
- The chart presents +/- 1 standard deviation of the ratio from its average since 1990, to identify excessive risk taking or aversion.
- Excessive risk taking is acknowledged when the ratio exceeds +1 standard deviation. Excessive risk aversion (avoidance of risk) is acknowledged when the ratio is below -1 standard deviation. Note this is one of many measures that may be considered in managing risk and or pursuing return.
- Currently this ratio implies excessive risk aversion which may appear to be somewhat counterintuitive, given the expectation for higher interest rates, current valuations, analyst downward revisions to earnings, and questions concerning the economy (in general).
Source: BTC Capital Management, Bloomberg Finance L.P., Refinitiv Datastream, FactSet
The information provided has been obtained from sources deemed reliable, but BTC Capital Management and its affiliates cannot guarantee accuracy. Past performance is not a guarantee of future returns. Performance over periods exceeding 12 months has been annualized.
This document is intended for informational purposes only and is not an offer or solicitation with respect to the purchase or sale of any security. Statements in this report are based on the views of BTC Capital Management and on information available at the time this report was prepared. Rates are subject to change based on market and/or other conditions without notice. This commentary contains no investment recommendations and you should not interpret the statement in this report as investment, tax, legal, and/or financial planning advice. All investments involve risk, including the possible loss of principal. Investments are not FDIC insured and may lose value.