
Welcome to Five in Five, a monthly publication from the Investment Team at BTC Capital Management. Each month we share graphs around five topics that illustrate the current state of the markets, with brief commentary that can be absorbed in five minutes or less. We hope you find this high-level commentary to be beneficial and complementary to Weekly Insight and Investment Insight.
This month’s Five in Five covers the following topics:
- Driver for Lower Inflation
- Employment
- Core Bond Relative Value
- Slowing Downward Earnings Revisions Help Equity Market
- Value Stocks Outperform Growth Stocks
1. Driver for Lower Inflation
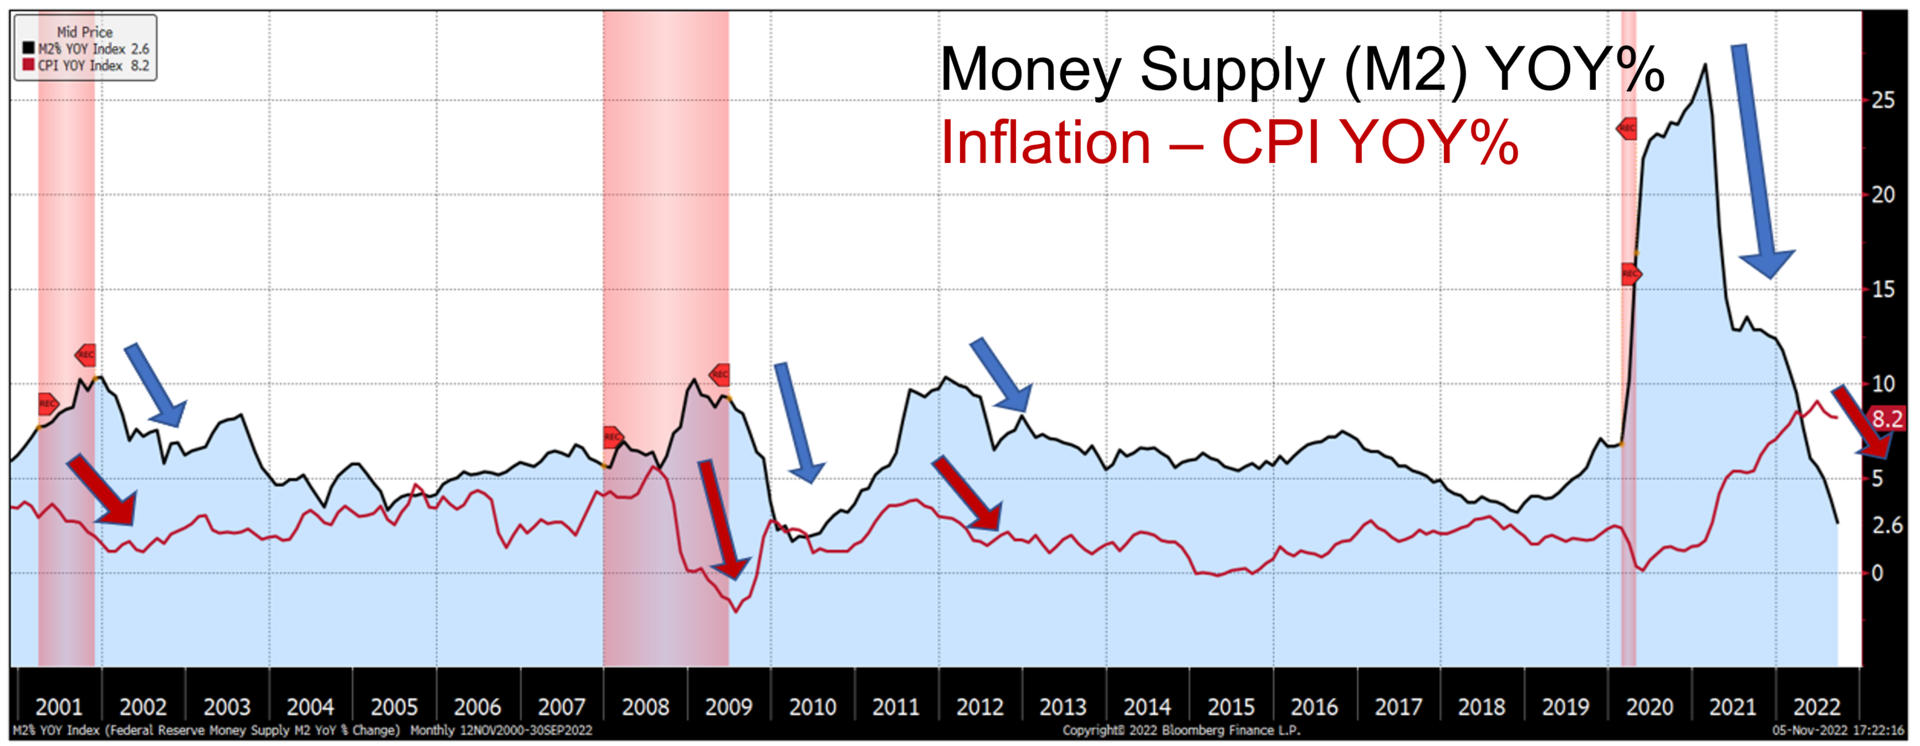
- Milton Friedman said, “Inflation is a monetary phenomenon.” When the supply of money grows higher (black line), inflation often is the result (red line).
- From February 2020 to February 2021 the money supply measured by M2 expanded three times.
- In 2020, inflation did not expand alone as the quantity of money also expanded as supply constraints kept goods out of the market and consumers from buying goods and services.
- Contraction of the quantity of money (M2) occurred fast enough in 2021-2022 to slow pent-up demand of consumers resulting in higher inflation.
- As the quantity of money continues to fall inflation will follow. Economist consensus projections are for a 3% Consumer Price Index rate by the end of 2023.
2. Employment
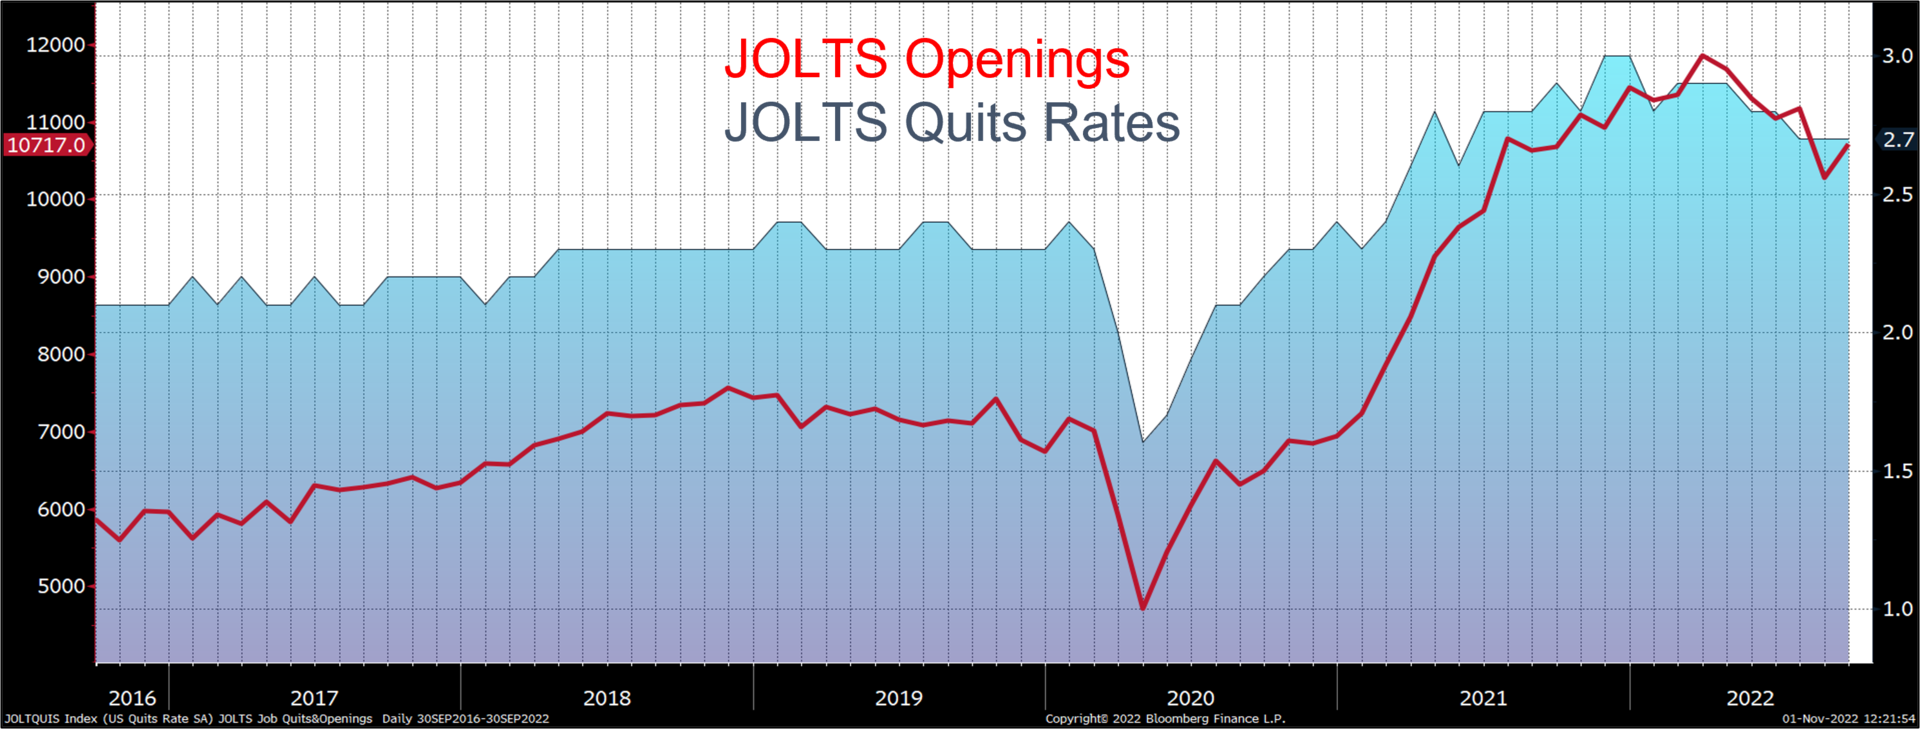
- National September Data showed 1.9 jobs available for every unemployed person compared to 1.7 in August.
- This unexpected rebound in September job openings continues to add pressure on firms to raise wages. ADP reported annual pay increases of 7.7% for job-stayers and 15.2% for job-changers.
- 4.1 million or 2.7% of the employed voluntarily left jobs (Quits Rate) well above the 20-year average of 2%.
- Strength in employment and accompanying wage inflation continues to put pressure on the Federal Reserve to raise short-term rates to slow borrowing that drives consumption and investment.
3. Core Bond Relative Value
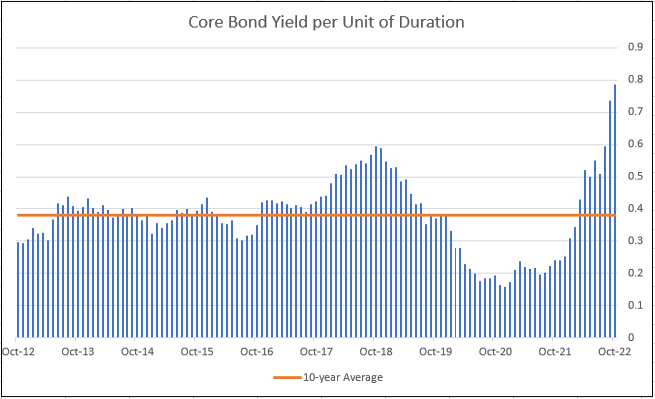
- Core bonds yield 0.78% per unit of duration.
- This is more than double the 10-year average.
- Core bonds offer the best risk/reward since 2009.
- The current yield-to-worst is about 4.95%.
- Set-up is favorable to owning fixed income in coming quarters.
4. Slowing Downward Earnings Revisions Help Equity Market
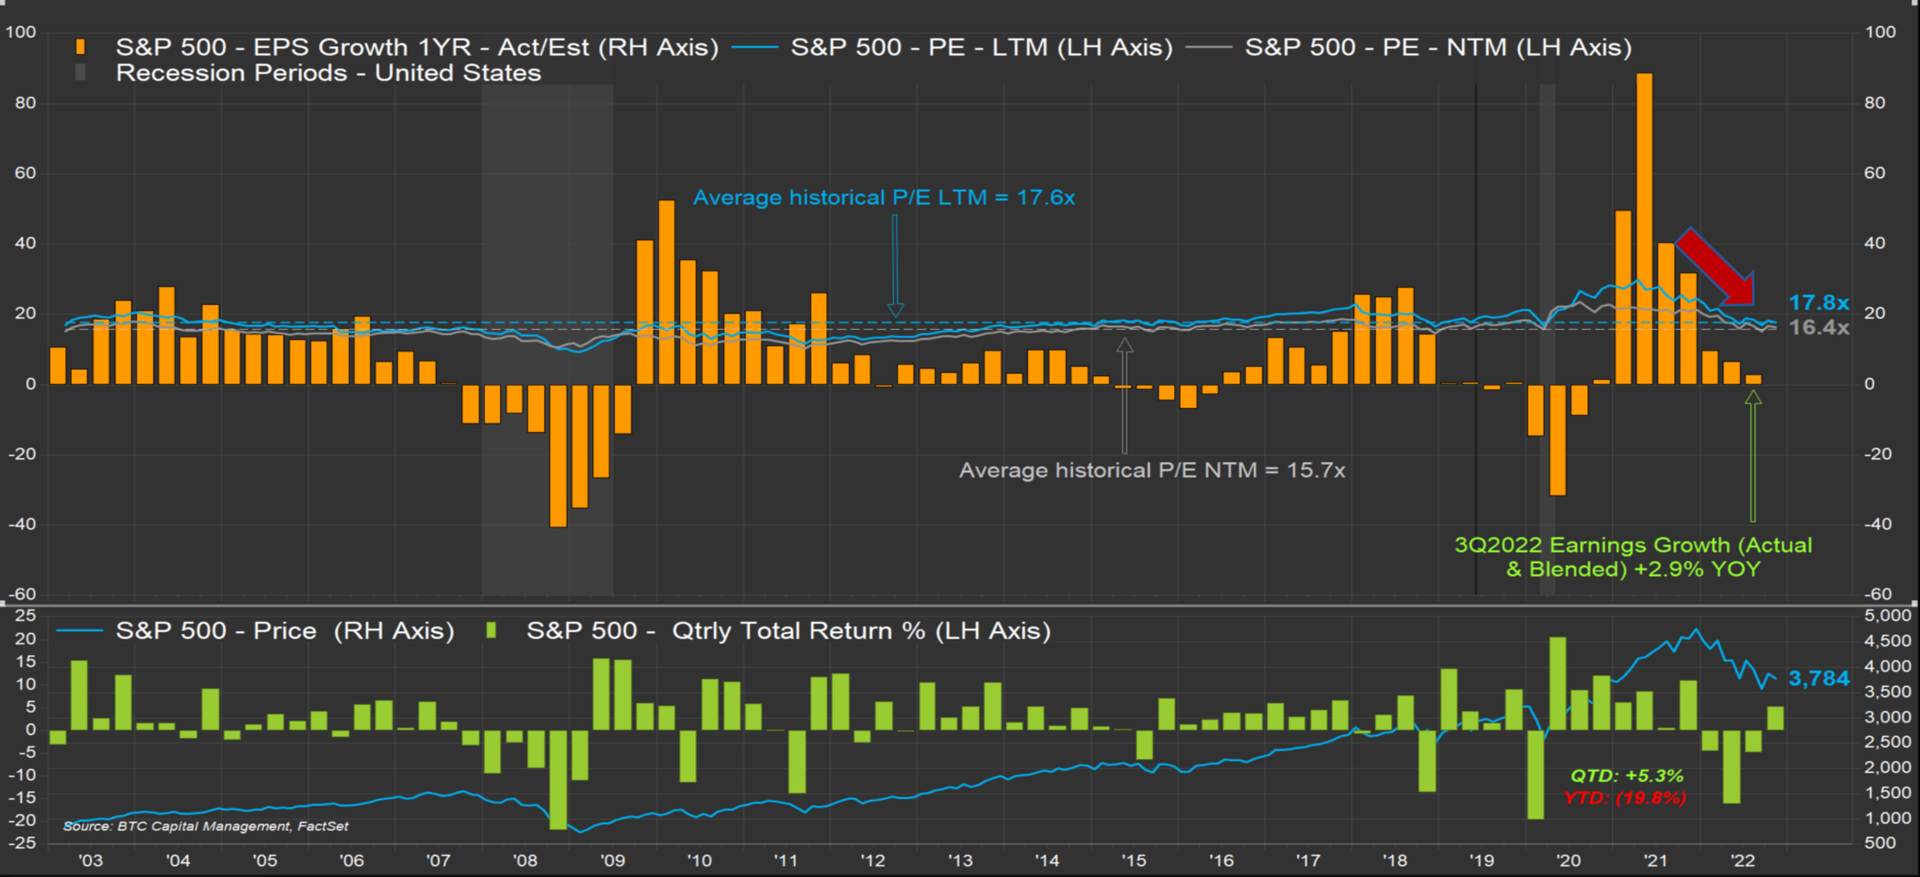
- Downward revisions have impacted valuations. Reference our October 2022 Five In Five in which we depicted the downward trend in analyst revisions for forward periods. For the third quarter 2022, earnings are projected to grow 2.9%.
- The chart above presents the year-over-year rate of change in quarterly earnings for the S&P 500. Note the steep downward slope on the right-hand side of the chart.
- Aware of this, investors have bid down index constituents, thus the index, as reflected in both the trailing price-to-earnings ratio (P/E LTM) and the forward price-to-earnings ratio (P/E NTM). Both are near their 20-year average but remain modestly above.
- The bottom portion of this chart depicts the quarterly returns for the S&P 500. Over time the index has correlated with the trend in earnings.
- That said, as we near the end of third quarter earnings reporting season, while year-to-date the index has declined 19.8%, quarter-to-date the index has risen 5.3%.
5. Value Stocks Outperform Growth Stocks
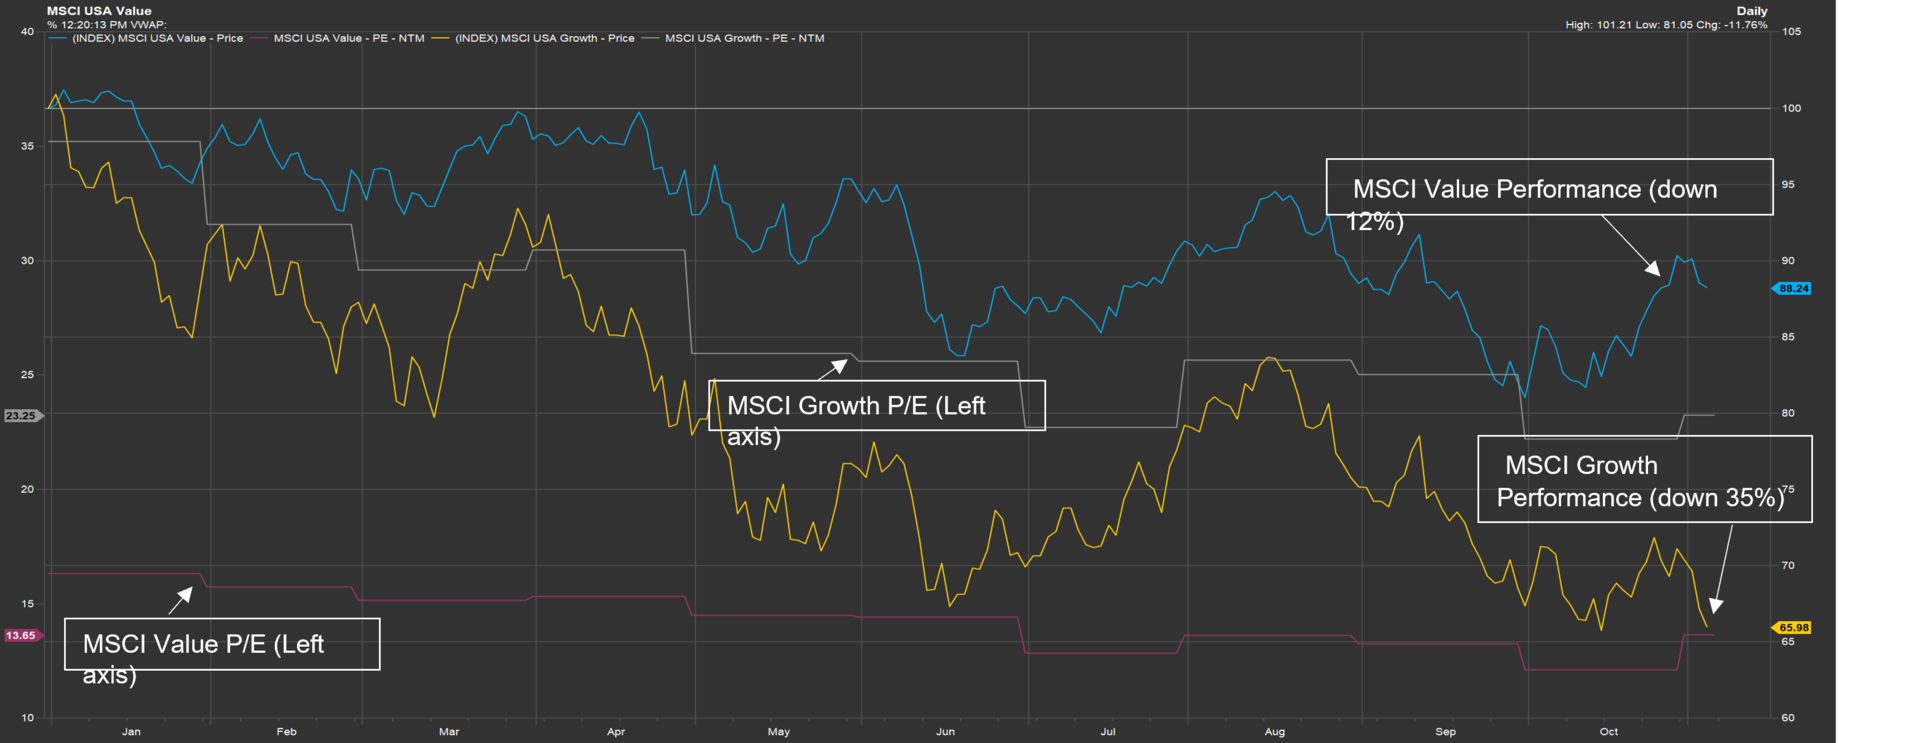
- Value has significantly outperformed Growth year-to-date with the MSCI Value Index down 12% while the MSCI Growth Index is down 35% for the same period.
- The price-to-earnings (P/E) ratio for the Growth index has significantly compressed since the start of the year falling from 35X P/E at the start of the year to its current level of 23X P/E as investors have adopted a “risk-off” mentality during this current period of high volatility.
- The P/E ratio for the Value index has compressed slightly falling from approximately 16X P/E at the start of the year down to its current level of approximately 13X P/E.
- The Growth P/E ratio is still at the high end of its 10-year range, indicating that if the current risk averse investment climate continues, stock valuations may still be considered “frothy” and may still have more room to fall.
- The Value P/E ratio is in the mid range of its 10-year range, indicating the market considers this group of stocks “fairly priced.
Source: BTC Capital Management, Bloomberg Finance L.P., Refinitiv Datastream, FactSet
The information provided has been obtained from sources deemed reliable, but BTC Capital Management and its affiliates cannot guarantee accuracy. Past performance is not a guarantee of future returns. Performance over periods exceeding 12 months has been annualized.
This document is intended for informational purposes only and is not an offer or solicitation with respect to the purchase or sale of any security. Statements in this report are based on the views of BTC Capital Management and on information available at the time this report was prepared. Rates are subject to change based on market and/or other conditions without notice. This commentary contains no investment recommendations and you should not interpret the statement in this report as investment, tax, legal, and/or financial planning advice. All investments involve risk, including the possible loss of principal. Investments are not FDIC insured and may lose value.