
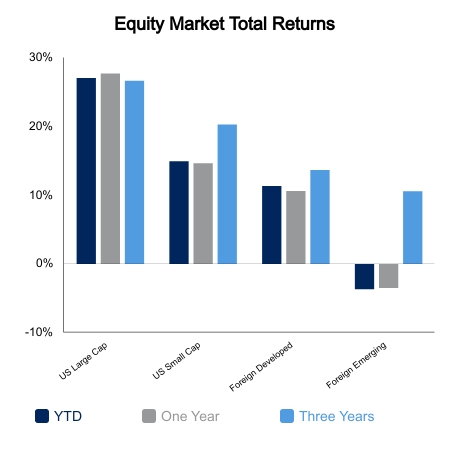
Global equities were up on the week in the range of 1-2% with broad participation across market cap and region. Stocks are now in the real “Santa Claus” rally window, which is the last five trading days in December plus the first two in January. It seems the narrative had shifted to the expectation that the entire month of December would yield a strong rally. This year the S&P 500 was roughly flat in first 20 days of the month, which was below the median of the last 20 years. The Bloomberg Barclays Aggregate Bond Index was down on the week as bond yields moved higher at the back end of the curve.
Personal Income and spending came in-line with expectations for the month of November. The early read on retail sales in December was released by the Mastercard SpendingPulse. This report indicated that holiday sales were up 8.5% versus the prior year. The narrative quickly viewed took this headline as a way to highlight the strength of the consumer. The window for this report is Nov. 1 to Dec. 24. The best proxy for this report is the U.S. Census Bureau’s Retail Sales Less Auto and Gas which has already been reported to be up 16.5% in November versus the prior year. Doing the basic math would indicate a sharp decline in retail sales for the month of December. While this indicator is only proxy, it would be quite a surprise to the market if retail sales were to exhibit this kind of contraction.
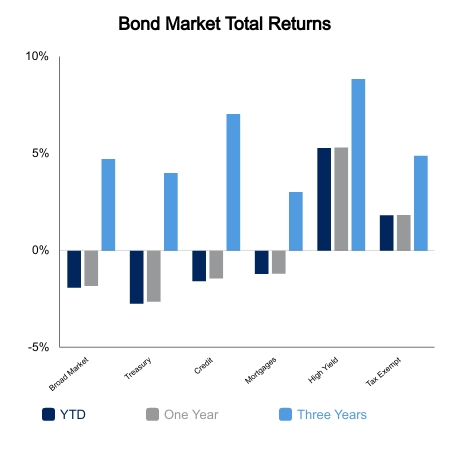
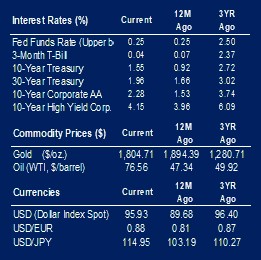
China has initiated some easing to help offset economic stress, however, at first blush it appears insufficient as their 10-year yield hit its lowest level of the year this week. Over the last five years, China government bond yields tend to lead the United States, especially when they break to new lows as they just did. Despite this, U.S. 10-year yields are roughly 60 basis points above of their 2021 low. The Bloomberg Treasury Index is set to record a negative return of about 2% for 2021. The index hasn’t recorded consecutive losing years since the 1950s. While this streak will certainly end at some point, we still have a strong historical precedent to suggest sharp losses on Treasuries remains a lower probability event. The Bloomberg Treasury Index has averaged an annual return of 6.9% over the last 40 years while the broader Bloomberg Aggregate Bond Index has compounded at 7.4%.
 |
 |
Source: BTC Capital Management, Bloomberg LP, Ibbotson Associates, FactSet, Refinitiv.
The information provided has been obtained from sources deemed reliable, but BTC Capital Management and its affiliates cannot guarantee accuracy. Past performance is not a guarantee of future returns. Performance over periods exceeding 12 months has been annualized.
The information within this document is for information purposes only and is not intended as an offer or solicitation with respect to the purchase or sale of any security. Statements in this report are based on the views of BTC Capital Management and on information available at the time this report was prepared. Rates are subject to change based on market and/or other conditions without notice. This commentary contains no investment recommendations and you should not interpret the statement in this report as investment, tax, legal, and/or financial planning advice. All investments involve risk, including the possible loss of principal. Investments are not FDIC insured and may lose value.