
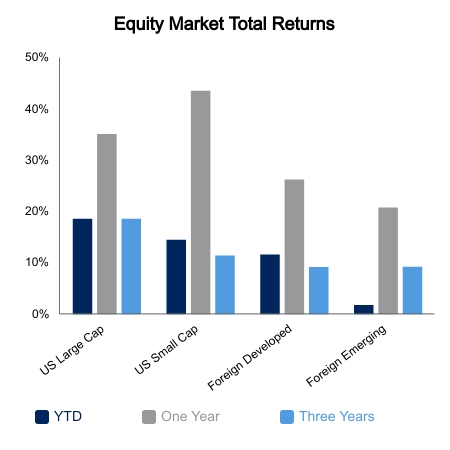
Domestic equities moved higher on the week; this time led by small caps. The Russell 2000 advanced 2.5% versus the 1.1% gain in the S&P 500. The NASDAQ was the laggard with a fractional drop. Emerging market equities remain weak and in the shadow of more restrictive Chinese regulatory policies. The Bloomberg Barclays Aggregate Bond Index was down 0.9% and yields moved higher on the week. The embers of the meme stock craze continue to flicker from time to time. It would only make sense that newly public Robinhood goes for a ride. The stock would rally 80% intraday before giving nearly all of it back in the week that followed.
Economic data was a focus point this week as the Bureau of Labor Statistics (BLS) employment report and inflation data was released. Yields moved higher following the BLS employment report that showed 943,000 net job gains. It was deemed a “blowout” by many despite barely exceeding the consensus forecast. If you back out the seasonal adjustments, there was a decline in jobs. Some are saying the seasonal adjustments could be off as hiring has followed the curve of the pandemic outbreak and not normal seasonal patterns. ADP private payrolls released earlier in the week showed only 330,000 private job gains. Historically speaking, the data tends to move toward ADP whenever there is a big discrepancy in the two reports.
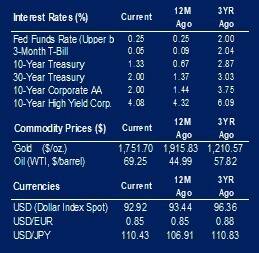
The Consumer Price Index (CPI) was in-line with expectations and up 5.4% versus the prior year. Core CPI was up 4.3% and down from the 4.5% reading in the prior month. The question remains whether this series will trend down in coming months, thereby solidifying the transitory framework. And while everyone was looking at these two highly anticipated events, data out of China was disappointing. Monthly imports and exports missed by a fair amount and more importantly the liquidity via their aggregate financing and money growth did not come to the rescue. All system financing in China missed by a lot and has been contracting most of the year. Chinese money supply via M2, or measurement of money supply, has been decelerating for an entire year. Despite this, one would be led to believe the United States is awash in liquidity. However, real M2 in the United States just posted its largest monthly decline since mid-2008. It appears as everyone waits on the Federal Reserve to move, the real tapering is already happening. This could be a big factor in why 10-year Treasuries only yielded 1.33% to the surprise of many.
 |
 |
Source: BTC Capital Management, Bloomberg LP, Ibbotson Associates, FactSet, Refinitiv.
The information provided has been obtained from sources deemed reliable, but BTC Capital Management and its affiliates cannot guarantee accuracy. Past performance is not a guarantee of future returns. Performance over periods exceeding 12 months has been annualized.
The information within this document is for information purposes only and is not intended as an offer or solicitation with respect to the purchase or sale of any security. Statements in this report are based on the views of BTC Capital Management and on information available at the time this report was prepared. Rates are subject to change based on market and/or other conditions without notice. This commentary contains no investment recommendations and you should not interpret the statement in this report as investment, tax, legal, and/or financial planning advice. All investments involve risk, including the possible loss of principal. Investments are not FDIC insured and may lose value.