
Stocks Rally as Fed Chair Powell Tees Up Interest Rate Cut
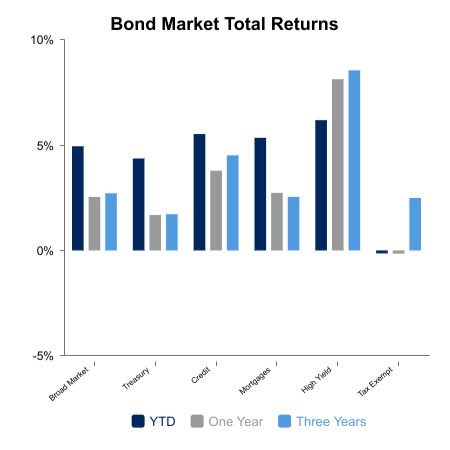
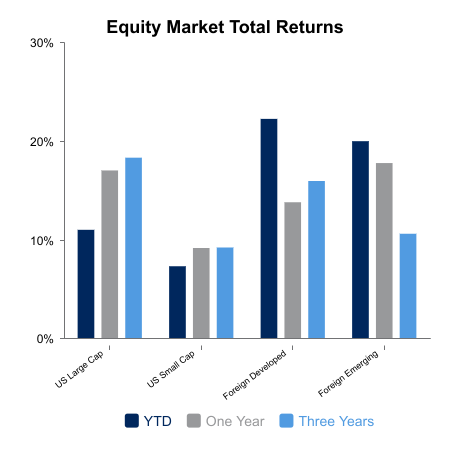
The market wasn’t expecting too much at the Jackson Hole gathering this year, but Federal Reserve Chair Jerome Powell surprised on the dovish side. The S&P 500 rallied about 1.5% on the day, but the big mover was small caps. The Russell 2000 was up over 3% on the day and 4.7% on the week. Core bonds advanced 0.4% as yields moved lower.
The Russell 2000 declined 5% from its recent high as the month of July concluded. However, the more than 7% advance in the eight days following has triggered signals that would suggest better than average expectation for robust gains over the ensuing year. This doesn’t mean that large caps must perform poorly, but there could be a surprise underway as the sentiment toward the laggard small caps is dire. This could be a similar setup to European banks and foreign developed equity markets that have been on a strong run in recent months.
The Russell 2000, the benchmark associated with small caps, was created in 1984. The ratio of the Russell 2000 to the S&P 500 was at its highest in its debut year, meaning small caps have consistently underperformed large caps for over 40 years. The S&P 500 has an average annual return that is 3.1% better than the Russell 2000 over this long span.
Fed Chair Powell hinted at rate cuts in his Jackson Hole speech, citing more concern over softening economic conditions versus inflation. The recent data might be contradicting this.
- The S&P Purchasing Managers’ Index (PMI) gauge jumped from 49.7 to 53.3.
- The S&P Services PMI increased from 54.2 to 55.4.
- The Citi Surprise Index broke an eight-month range to hit its highest level since December.
- Core PCE has been over 2% for 52 straight months.
The Fed began hiking rates in 2004 with PCE under 2%, but the slow, quarter-point pace allowed for inflation to ultimately stay above 2% for 31 straight months over the next couple of years. The current streak is the second longest since the data series began in 1960. Inflation was over 2% in every month from June 1966 to January of 1996, or 356 consecutive months.
We have noted that September and October can be volatile months, so one should be on watch for this. The VIX (implied volatility) is at 14 and might seem complacent, but actual realized S&P 500 volatility over the last 50 days is just 9.4. This is the lowest reading in over a year.
 |
 |
Sources: BTC Capital Management, Bloomberg
The information provided has been obtained from sources deemed reliable, but BTC Capital Management and its affiliates cannot guarantee accuracy. Past performance is not a guarantee of future returns. Performance over periods exceeding 12 months has been annualized.
This content is provided for informational purposes only and is not intended as an offer or solicitation with respect to the purchase or sale of any security. Statements in this report are based on the views of BTC Capital Management and on information available at the time this report was prepared. Rates are subject to change based on market and/or other conditions without notice. This commentary contains no investment recommendations and should not be interpreted as investment, tax, legal, and/or financial planning advice. All investments involve risk, including the possible loss of principal. Investments are not FDIC insured and may lose value.