
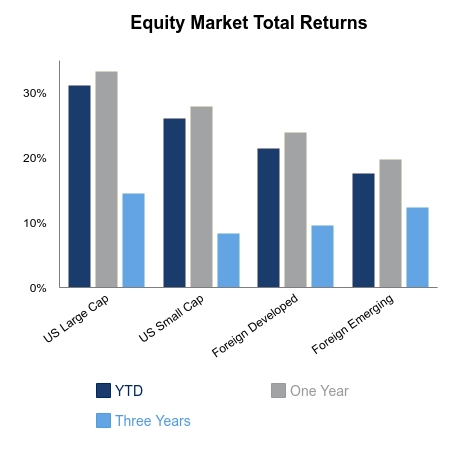
This last Weekly Insight of 2019 highlights the end of another eventful year. We came into 2019 with some fire under our feet after closing out 2018 with increased market volatility. The VIX, a measure of market volatility, was at 30 a year ago today. Now, it’s closer to 13 and is well below its average of 19 since its inception in 1990. The S&P 500 dropped by close to 10% in December 2018. This index is now up over 3% this month-to-date and up over 30% year-to-date. There is a wide gamut of expectations for the coming year. For the most part, market analysts are optimistic and expect positive growth in earnings and sales.
We close the year with mixed economic news. Consumer sentiment, as measured by the Michigan Sentiment Indicator, continues to be positive. Its recent reading of 99.3 was in line with expectations and also the previous month’s reading of 99.2.
Personal income for November grew by 0.5%. The increase was led by compensation to employees, farm proprietors’ income, and personal interest income. Personal consumption expenditures (PCE) increased by 0.4% month-over-month in November, and year-over-year PCE grew by 1.5%. This growth was expected but was lower than the historical average. The PCE is the preferred inflation measure for the Federal Reserve, which announced earlier this year it was de-emphasizing its focus on inflation within its rate-setting policy.
Durable goods orders dropped for the second time in three months. The decrease of 2% was led by a 5.9% decrease in transportation equipment orders and a 35.6% decrease in defense orders. The expectation was for growth of 1.5% in new orders. Excluding defense orders, new orders grew by 0.8%.
Existing home sales were lower than expected. In November, 5.35 million homes were sold, which was lower than the expected 5.44 million. However, we have seen year-over-year growth in home sales this year after 2018 closed with home sales of just 5 million in December. New home sales were at 719,000, lower than the expected 730,000. This compares with 564,000 for December 2018.
The Leading Indicators Index, which tracks 10 leading indicators, was flat in November. The consensus was for an increase of 0.10.
We at BTC Capital Management wish you a happy, healthy and prosperous 2020!
 |
 |
Contributed by | Kuuku Saah, CFA, Investment Analyst
Kuuku is an Investment Analyst at BTC Capital Management with nine years of investment management experience. Kuuku’s primary responsibilities include portfolio management and analysis. Kuuku attended Drake University and double-majored in finance and economics. He is a holder of the right to use the Chartered Financial Analyst® designation.
Source: BTC Capital Management, Bloomberg LP, Ibbotson Associates, FactSet.
The information provided has been obtained from sources deemed reliable, but BTC Capital Management and its affiliates cannot guarantee accuracy. Past performance is not a guarantee of future returns. Performance over periods exceeding 12 months has been annualized.
The information within this document is for information purposes only and is not intended as an offer or solicitation with respect to the purchase or sale of any security. Statements in this report are based on the views of BTC Capital Management and on information available at the time this report was prepared. Rates are subject to change based on market and/or other conditions without notice. This commentary contains no investment recommendations and you should not interpret the statement in this report as investment, tax, legal, and/or financial planning advice. All investments involved risk, including the possible loss of principal. Investments are not FDIC insured and may lose value.