
Market Volatility Rises Amid Tariff Uncertainty and Mixed Economic Signals
Key Takeaways
- Volatility rears its head.
- A decision does not negate tariffs.
- Key developments on the macro front.
Volatility rears its head
Volatility exhibited a sustained rise month‑to‑date. The CBOE Market Volatility Index (VIX), which measures 30-day implied volatility based on option prices for the S&P 500 Index, ended 2025 at 14.9. While the VIX jumped to 20.1 on January 20, it remained rangebound going into February. The VIX spiked at 21.8 on February 5 in what may be a sustained near‑term uptrend.
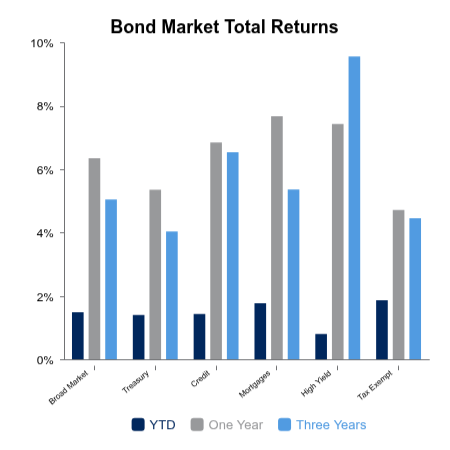
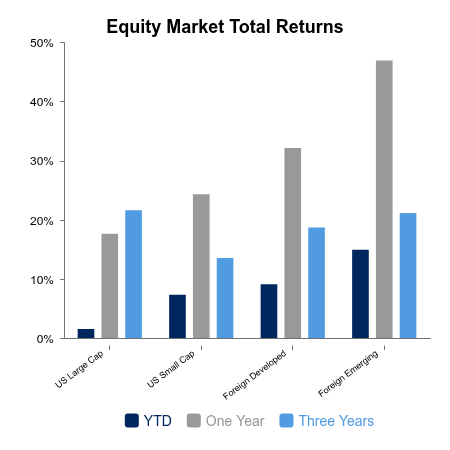
Equity returns were muddled over this past week. The Russell 3000 Index rose 0.9%, while the MSCI All-Country World Index ex-USA (ACWI ex-USA) advanced 1.5%. The Russell 2000 Index rose a modest 0.2%, driven by a rise of 0.4% in the Russell 2000 Growth Index. Bonds rose 0.2% over this past week.
Looking forward, March appears to have historically exhibited positive equity returns. According to Bloomberg, over the last five years the Russell 3000 exhibited an average return of 1.2% during March while the ACWI ex-USA averaged 1.4% over that same period.
A decision does not negate tariffs
In a 6-3 ruling, the U.S. Supreme Court negated the Trump Administration’s use of the International Economic Emergency Powers Act to impose tariffs. The Administration immediately responded by exercising other mechanisms that appear to have been anticipated by investors. Equity markets initially declined but subsequently retraced.
Since “Liberation Day” last April, U.S. publicly‑traded companies have actively managed and, as part of their quarterly earnings reports, communicated efforts to mitigate the impact ascribed to the fluid tariff landscape.
On the macro front
The Bureau of Economic Analysis (BEA) released its first preliminary estimate of fourth‑quarter 2025 U.S. Gross Domestic Product (GDP), reporting real GDP increased at an annual rate of 1.4%, materially below the prior quarter’s 4.4%. Increases in consumer spending and investment were partially offset by decreases in government spending and exports.
S&P Global released its U.S. Flash PMI (Purchasing Managers Index) for February. S&P characterized the rise in both the manufacturing and services components (to 51.2 and 52.3, respectively) as “the weakest rate [in] ten months,” attributed to weak end‑demand, higher prices and adverse weather.
Fourth‑quarter earnings season is winding down, and corporate profitability appears resilient in the face of tariff uncertainty. Companies comprising the MSCI USA Investable Market Index (a broad measure of domestic large cap and small cap companies) posted earnings growth of 12.5% year‑over‑year (YOY). Companies comprising ACWI ex‑USA (a broad measure of both foreign developed and emerging markets) reported earnings growth of 14.6%.
 |
 |
Sources: BTC Capital Management, FactSet Research Systems Inc., MSCI Inc., Bloomberg LP, U.S. Bureau of Economic Analysis, S&P Global.
The information provided has been obtained from sources deemed reliable, but BTC Capital Management and its affiliates cannot guarantee accuracy. Past performance is not a guarantee of future returns. Performance over periods exceeding 12 months has been annualized.
This content is provided for informational purposes only and is not intended as an offer or solicitation with respect to the purchase or sale of any security. Statements in this report are based on the views of BTC Capital Management and on information available at the time this report was prepared. Rates are subject to change based on market and/or other conditions without notice. This commentary contains no investment recommendations and should not be interpreted as investment, tax, legal, and/or financial planning advice. All investments involve risk, including the possible loss of principal. Investments are not FDIC insured and may lose value.