
Equities Whipsaw Around Conflicting Economic Data and Powell Comments
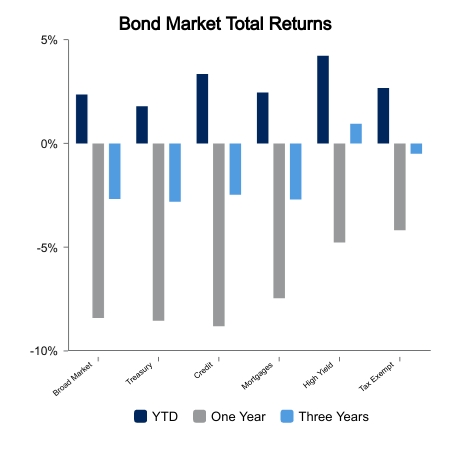
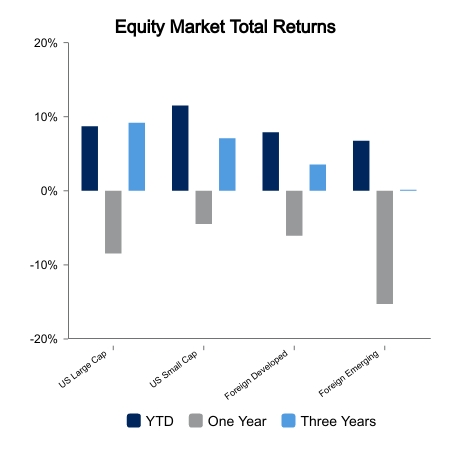
The S&P 500 was flat on the week but showed noticeable volatility intraday. A slight uptick in NASDAQ- related names was offset by slight weakness in value equities. This is a good sign that large January gains are holding. A modest rebound in the dollar sent emerging markets down 2.1%. Fixed income was down 1.4% on the week as a strong jobs report pushed yields higher.
What’s the Signal?
The economic data continue to confound and send varying signals. This week was one of the better ones.
- The Institute of Supply Management (ISM) new orders, a component of the Conference Board Leading Economic Index, came in at a cycle low reading of 42.5.
- ISM Services new orders were 55.8 in November, 45.2 in December and 60.4 in January.
- The Bureau of Labor Statistics reported that Nonfarm Payrolls jumped 517,000, which was 2.7 times more than the consensus expectation. It was so high there was a plethora of reputable economists questioning the accuracy.
- The unemployment rate fell to 3.4% as weekly wages made a big move higher.
- The Household survey, which has been badly lagging the Establishment survey, played a bit of catch-up with a reported gain of 1.1 million jobs.
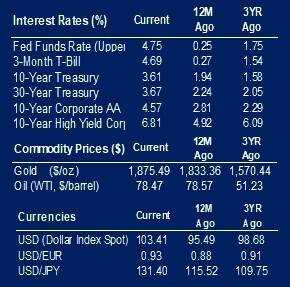
Treasury yields made a sharp pivot on the stronger jobs report. The 2-year yield was up 37 basis points in two days. Despite the pop in yields, stocks held in very well. Jerome Powell spoke on Tuesday after the blowout jobs report. This was preceded by a lot of fear he would change his tune and talk down markets. He did not, and it appears the Fed is less inclined to require stocks continue to suffer if inflation is trending down.
Are Equity Market Internals Sending the Signal?
There continues to be doubt a new bull market has begun. During the last 10 official U.S. Recessions, the median S&P 500 decline was about 24%. Last year, the S&P 500 drawdown was 25%. The one important fact that is often missed on financial media is stocks bottom 6-9 months before earnings bottom. It is hard for people to visualize that stocks will anticipate the earnings trough.
Are there any signs growth may be better than expected and/or earnings are expected to improve? The internals of the market would suggest this may be the case as deep cyclical industries are showing the strongest gains. Real Estate Services leads all industries over the last three months with a gain of 41%. Home construction is up 31%, Steel is up 30% and Semiconductors are up 28%. Defensive industries such as Tobacco, Banking, Utilities and Aerospace are the laggards.
 |
 |
Source: BTC Capital Management, Bloomberg LP, FactSet, Refinitiv (an LSEG company).
The information provided has been obtained from sources deemed reliable, but BTC Capital Management and its affiliates cannot guarantee accuracy. Past performance is not a guarantee of future returns. Performance over periods exceeding 12 months has been annualized.
This content is provided for informational purposes only and is not intended as an offer or solicitation with respect to the purchase or sale of any security. Statements in this report are based on the views of BTC Capital Management and on information available at the time this report was prepared. Rates are subject to change based on market and/or other conditions without notice. This commentary contains no investment recommendations and should not be interpreted as investment, tax, legal, and/or financial planning advice. All investments involve risk, including the possible loss of principal. Investments are not FDIC insured and may lose value.