
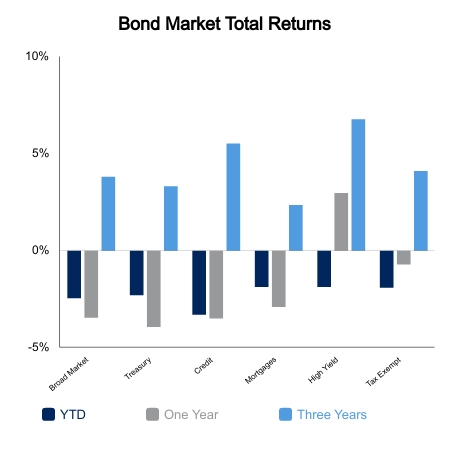
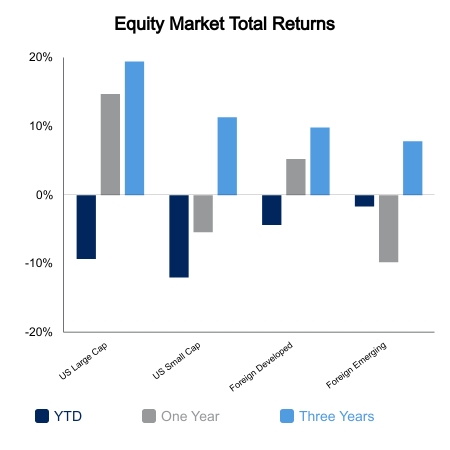
Equities continue to slide to start the year as interest rate hike expectations continue to rise. The S&P 500 was down 4.0% but fared better than the 5.6% drop in the NASDAQ. Bonds were also down on the week. After tallying things up for the year, cash is at the top of the list on performance. The Bloomberg Barclays Aggregate Bond Index is down 2.5%, the S&P 500 minus 8.7%, and the NASDAQ minus 13.4%.
The NASDAQ was able to pull off its second largest intraday drop with a green close, falling 4.9% at the lowest before rallying back on Monday. The only larger comeback was October of 2008. The immediate forward returns following these events were quite poor as these moves are often seen in bear markets. More than half the time the lows are undercut. The VIX Index has closed green for seven consecutive trading sessions. While the streak is still alive, based on early price action this morning it will likely end up as the third longest streak since data began in 1990. But you still might want to check for yourself, because this week has seen plenty of 2% moves over the course of just an hour or two.
Rounding out the week was the Federal Open Market Committee meeting. The Fed appears poised to raise rates at its next meeting in March. The rhetoric was very hawkish with the market focusing on comments like, “I think there is quite a bit of room to raise interest rates without threatening the labor market.” This time the NASDAQ would reverse a 3.4% intraday gain to close unchanged.
The market is now pricing in five full interest rate hikes over the next 12 months. The problem not often cited in the media is that many longer dated yield curves are already close to inverting and we haven’t even started hiking. For instance, the 5-year and 10-year spread is just 14 basis points (bps) today. The steady approach hiking cycles that began in 1994, 2004, and 2015 began with this spread between 50-80 bps. There is precedent for the Fed to hike with this yield curve at the current level. Allen Greenspan moved rates a bit in the late 1990s and the last hiking cycle of that decade began with about 10 bps of spread. In 1999, Greenspan lifted rates to combat rising inflation, partly aided by his cuts in 1998 to save the equity market despite a strong economy. This yield curve would ultimately invert by about 40 bps as the 2000 equity bubble peaked and rolled over.
 |
 |

Source: BTC Capital Management, Bloomberg LP, Ibbotson Associates, FactSet, Refinitiv.
The information provided has been obtained from sources deemed reliable, but BTC Capital Management and its affiliates cannot guarantee accuracy. Past performance is not a guarantee of future returns. Performance over periods exceeding 12 months has been annualized.
This content is provided for informational purposes only and is not intended as an offer or solicitation with respect to the purchase or sale of any security. Statements in this report are based on the views of BTC Capital Management and on information available at the time this report was prepared. Rates are subject to change based on market and/or other conditions without notice. This commentary contains no investment recommendations and should not be interpreted as investment, tax, legal, and/or financial planning advice. All investments involve risk, including the possible loss of principal. Investments are not FDIC insured and may lose value.