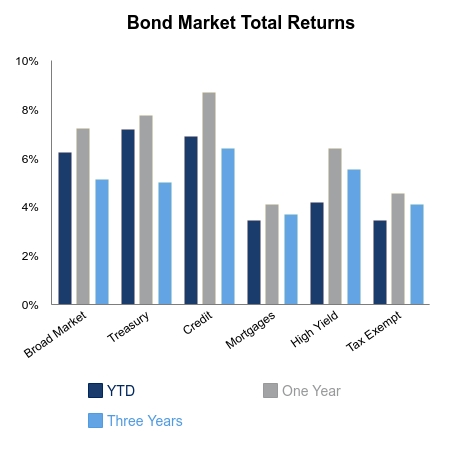
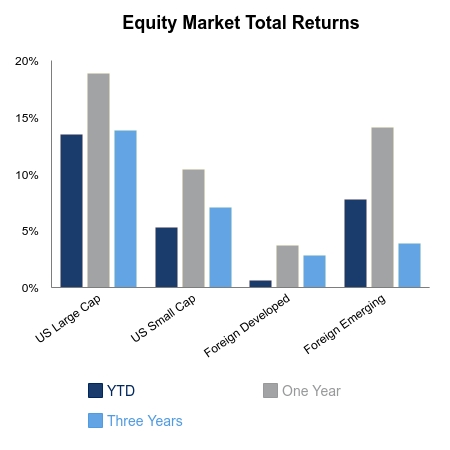
S&P 500 one-week performance was strong. Over the period, the index was up 3.81%. This performance was led by Energy, up 14.29%, and Financials, up 10.20%. These are the two sectors which have struggled the most this year. The returns come on the heels of positive news of a COVID-19 vaccine and a little more general election clarity. The expectation is that economic activity will pick up as a vaccine is disbursed. Demand for oil is also expected to increase.
We are approaching the end of the 2020 third quarter earnings season. A little over 90% of companies have already reported and results were not as ugly as we thought they were going to be. Earnings came in 19% better than expected. Year-over-year, earnings declined by 7.10%. We saw the largest positive surprises in the Consumer Discretionary and Industrials sectors. They were 78% and 35% better than expected, respectively. Sales for the quarter were 2.42% better than expected. Sales growth declined by 2.22% in the quarter. The performance was led by strength in the Communication Services and Consumer Discretionary sectors.
Month-over-month, hourly earnings grew less than expected. October’s growth of 0.10% was less than the expected 0.20%. Real hourly earnings, or hourly earnings after adjusting for inflation, may see a decline after the Consumer Price Index number comes out this week.
Manufacturing payrolls were lighter than expected. The reading of 38.0K compares unfavorably with the expected 50.0K and last month’s 60.0K.
A bright spot in the economic picture was employment. The unemployment rate is down to 6.9%, which is down a full percent from last month. The improvement was led by employment gains in the leisure and hospitality, professional and business services, and retail trade and consumer services industries. Government employment was a drag on the number. 11.1 million remain unemployed in the United States, which is down 1.5 million from last month.
Americans took on more debt than expected in September. Consumer credit for the month was at $16.2 billion. This is significantly higher than the expected $10 billion. This is a 4.7% increase from last year. Revolving credit was up 4.8% and nonrevolving credit was up 4.6%. These numbers come after trends of consumers aggressively paying down debt through the beginning of the pandemic.
 |
 |

Source: BTC Capital Management, Bloomberg LP, Ibbotson Associates, FactSet.
The information provided has been obtained from sources deemed reliable, but BTC Capital Management and its affiliates cannot guarantee accuracy. Past performance is not a guarantee of future returns. Performance over periods exceeding 12 months has been annualized.
The information within this document is for information purposes only and is not intended as an offer or solicitation with respect to the purchase or sale of any security. Statements in this report are based on the views of BTC Capital Management and on information available at the time this report was prepared. Rates are subject to change based on market and/or other conditions without notice. This commentary contains no investment recommendations and you should not interpret the statement in this report as investment, tax, legal, and/or financial planning advice. All investments involve risk, including the possible loss of principal. Investments are not FDIC insured and may lose value.

