
We presume all cannot wait for 2022 to say goodbye. U.S. equities, as measured by the Russell 3000 Index, are currently down 19.8% year-to-date (YTD), which may be its worst calendar-year drawdown since 2008 ( 37.3%). Likewise, the MSCI All-Country World Index, a measure of foreign equities, is down 16.1% YTD, its worst year also surpassed only by 2008 ( 40.6%).
As strategists have commented, investors have been presented with an option outside of equities given rising interest rates. The perception that equities were the exclusive return generator, otherwise known as TINA (there is no alternative), has given way to TARA (there are reasonable alternatives).
So, what may this mean for equities in 2023?
Front-of-Mind Themes
Several key themes will persist into 2023. Inflation, interest rates, and sentiment will be front of mind as we navigate into and through 2023.
Inflation, Corporate Revenues and Earnings
Inflation, which has driven monetary authorities throughout the globe to combat inflation expectations by raising key interest rates, has been a two-edged sword impacting equities. On the one hand, consumers have seen real wages decline, thus their capability to sustain spending has been called into question. On the other hand, certain companies have been able to pass on higher costs in the form of price increases, thus we have seen a modicum of sustainment in revenues. The question is, will this continue through 2023?
According to FactSet, for 2023, analysts estimate revenue growth of 2.5% year-over-year (YOY) for U.S. companies. Outside the U.S., where inflation has (in some regions) exceeded that of the U.S., analysts estimate revenue growth of 2.9% YOY for foreign companies.
Margins are expected to modestly expand during 2023. Given the modest growth projected for revenues, margin expansion should support a thesis of earnings growth during 2023. Analysts currently project 2023 earnings growth above that forecasted for 2022. U.S. companies exhibit a higher rate of growth than foreign peers, at 7.0% YOY and 1.0%, respectively.
Interest Rates and Valuations
Interest rates rose throughout 2022, which adversely impacted equity valuations. Coupled with downward analyst revisions of forward earnings, price-to-earnings ratios (P/Es) contracted throughout 2022, as depicted in the following chart.
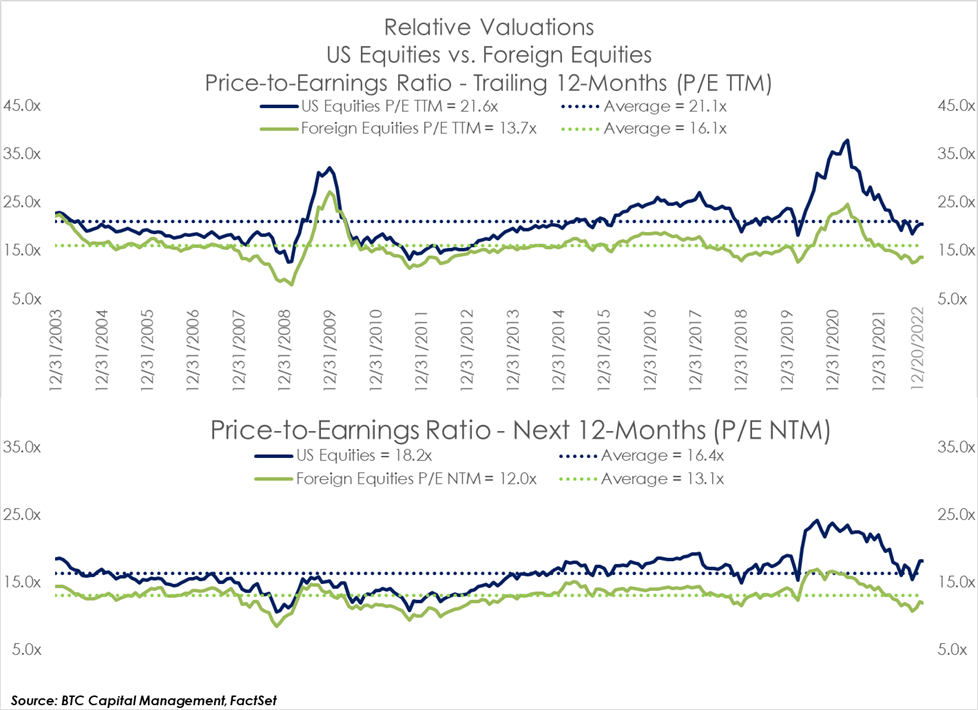
Equity valuations appear mixed. Within the U.S., the trailing twelve-month P/E (P/E TTM) for U.S. equities marginally exceeds its average over the last 20-years. Outside the U.S., the P/E TTM for foreign equities has been below its 20-year average.
Given the rise in interest rates and continued downward revisions to earnings by analysts, one may expect forward P/Es to compress further during 2023, a result of the challenging macro and geopolitical environments. Note from this chart, the P/E for each index for the next twelve-months (P/E NTM) is below the P/E TTM for each index. While the P/E NTM for U.S. equities is somewhat inflated relative to its historical average, it is materially below that exhibited at the beginning of 2022. The P/E NTM of foreign equities is below its historical average. Note that, in aggregate, U.S. equities traditionally trade at higher multiples than their foreign peers, primarily due to the perceived earnings power of U.S. companies.
Sentiment
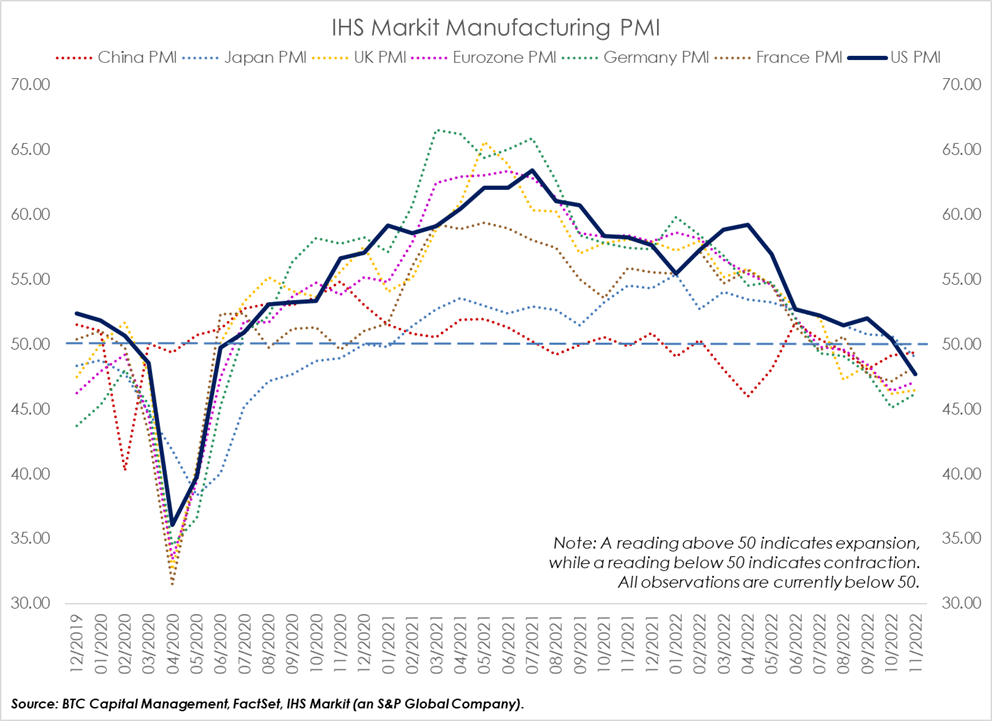
Sentiment has diminished due to concerns of a global recession as central banks around the world raised key interest rates in efforts to combat rising inflation. Major global economic activities, including manufacturing, declined during 2022. One key metric of manufacturing presented in the following chart is the Purchasing Managers Index (PMI) which measures the trend in manufacturing activity. Recent readings fell below 50, indicating a contraction in manufacturing activity in many countries around the world. This has been a leading indicator of corporate profitability, as one may infer given the trend in analyst revisions previously discussed.
Volatility will likely remain amplified in equity markets as we navigate through 2023. While near-term equity sentiment seems tepid, investors may be warming to a more conducive market in the longer-term. More strategists have commented on the Fed’s efforts to induce a soft-landing within the U.S., presuming inflation has peaked. Resilience of the consumer, whose spending represents approximately two-thirds of domestic GDP, was a positive takeaway from recent earnings reports. This theme is supported by the current, continuing strength in the labor market. Additionally, recent inflows into U.S. equities appears to be running above $200 billion YTD, some of which appears to be attributed to “FOMO,” or the fear of missing out.
But what about the fundamentals? Going back to our earlier comments regarding forward earnings and valuations, we present the following chart which depicts potential outcomes for the S&P 500.
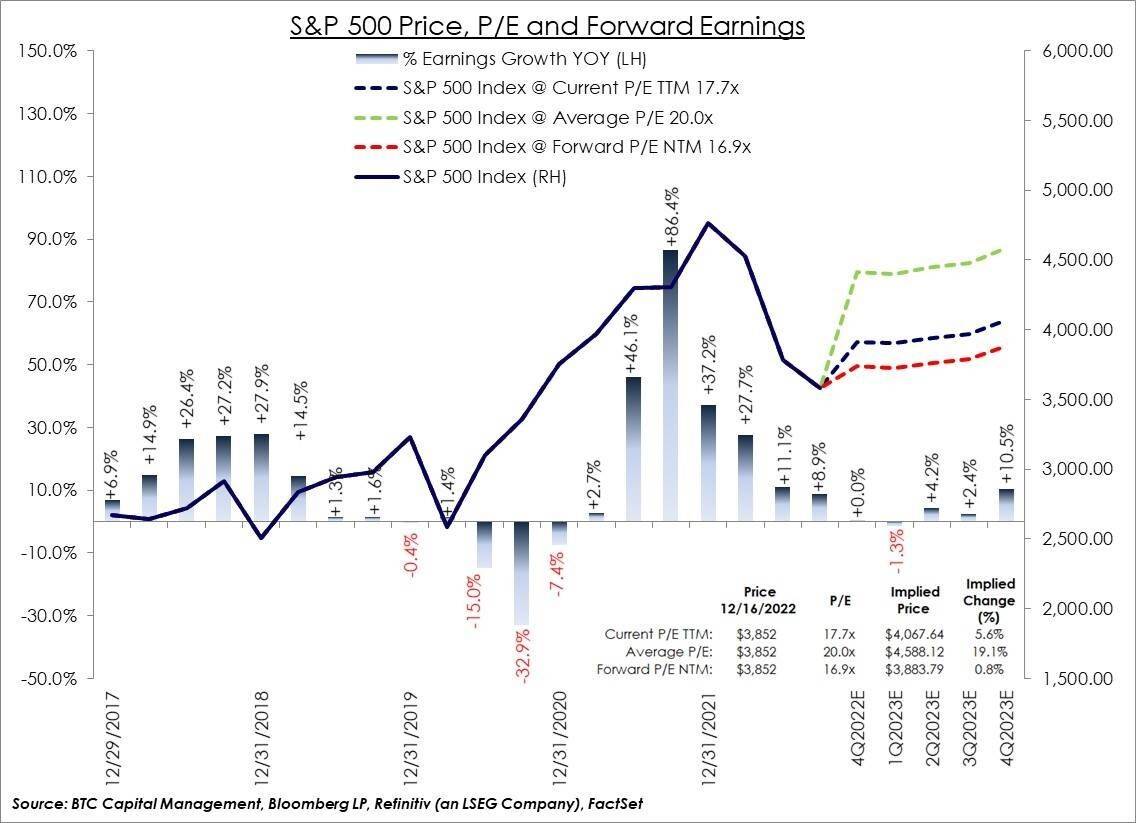
Presuming the current quarterly earnings estimates by analysts are realized through the end of 2023 and applying the valuations scenarios presented in the chart (Current P/E TTM, historical Average P/E, Forward P/E NTM), note the potential price change under each scenario is positive. The base case scenario (current P/E TTM) implies valuations will be sustained with equity returns bolstered by modest growth in earnings.
Summary
Equity markets will continue to be volatile throughout 2023. Given the fluid macro‑environment, specifically monetary policy related to inflation, interest rates, and geopolitical challenges, an awareness of the prospective trend in revenues and earnings coupled with valuation may best serve equity investors. Liquidity may also be a key factor in navigating through 2023, thus an emphasis on U.S. relative to foreign and developed markets relative to emerging markets.
Source: BTC Capital Management, FactSet, Refinitiv (an LSEG company).
The information provided has been obtained from sources deemed reliable, but BTC Capital Management and its affiliates cannot guarantee accuracy. Past performance is not a guarantee of future returns. Performance over periods exceeding 12 months has been annualized.
This content is provided for informational purposes only and is not intended as an offer or solicitation with respect to the purchase or sale of any security. Statements in this report are based on the views of BTC Capital Management and on information available at the time this report was prepared. Rates are subject to change based on market and/or other conditions without notice. This commentary contains no investment recommendations and should not be interpreted as investment, tax, legal, and/or financial planning advice. All investments involve risk, including the possible loss of principal. Investments are not FDIC insured and may lose value.
Mark Mandziara, Senior Managing Director
Read my bio
Dwayne Krpan, CFA, Managing Director
Read my bio