
Inflation Readings Move Higher
Key Takeaways
- Higher fuel costs provide major contribution to inflation data.
- Labor markets continue to show resilience.
- Emerging markets lead equity markets.
This week saw employment and inflation updates at the forefront of economic data releases. On the labor front, nonfarm payrolls increased more than forecast for the month of April with an increase of 115,000. The unemployment rate was unchanged at 4.3% and jobless claims, both initial and continuing, were lower than forecast for the week. These reports are indicative of the ongoing “slow to hire, slow to fire” status of the labor market which continues to exhibit meaningful resilience in the face of prospective A.I. induced job losses.
Updated inflation data for the week included both the Consumer Price Index (CPI) and Producer Price Index (PPI). Both indices reported higher readings relative to their respective forecasts and prior month readings. On a year-over-year (YOY) basis, CPI rose 3.8% versus the prior month’s 3.3%. The PPI, up 1.4% in April, registered an increase of 6.0% YOY. Similar results were reported for the CPI after removing the more volatile food and energy components. Higher fuel costs were the obvious culprit contributing to the higher readings with gasoline prices rising 5.4% in April. Another significant contributor to the upswing was electricity, up 2.1% for the month.
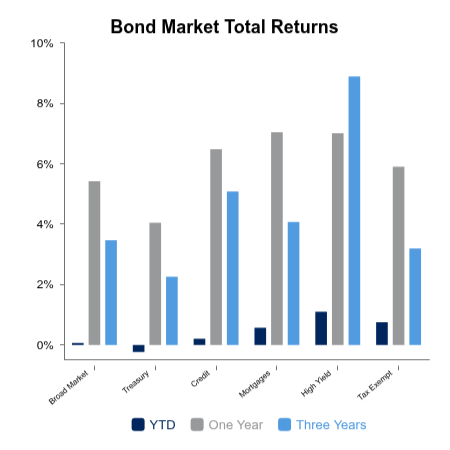
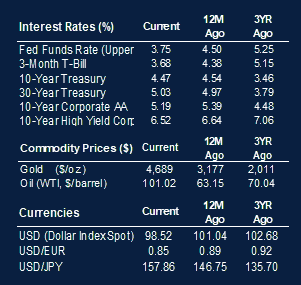
Bond markets responded to the inflation data by pushing interest rates higher. The yield for the 10-year U.S. Treasury issue rose to 4.47% from 4.35%. This led to a broad market weekly return for bonds of -0.5% and pushed the year-to-date (YTD) return down to -0.05%. With the reported increases in inflation and commensurate rise in bond yields, the probability of a cut in the Federal Funds rate in 2026 is now virtually zero.
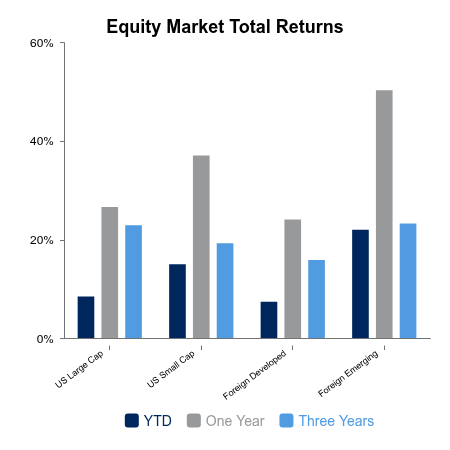
For the most part, equities fared better than their fixed income counterparts for the week. While small cap domestic and developed foreign market indices delivered small declines for the week, large cap domestic and emerging market indices moved higher. Growth stocks continued to outperform value issues as they have throughout this quarter. However, Value stocks continue to have stronger YTD returns with the Russell 3000 Value Index returning 12.2% compared to the 5.9% for the Russell 1000 Growth Index. Thus far in 2026 Emerging Market equities tower over other indices with a YTD return of 22.2%.
Lastly, first quarter earnings season is nearing a close with over 89% of S&P’s 500 Index companies having reported. In aggregate earnings growth for the quarter is expected to register an increase of 27.7% with a majority of the results for the component companies coming in higher than expected. If this is the actual growth rate when all companies have reported, it will be the highest quarterly performance since the fourth quarter of 2021.
 |
 |
Sources: BTC Capital Management, FactSet Research Systems Inc., Federal Open Market Committee (Federal Reserve) LSEG I/B/E/S, FTSE Russell (an LSEG Group company), S&P Global, U.S. Bureau of Labor Statistics, U.S. Census Bureau.
The information provided has been obtained from sources deemed reliable, but BTC Capital Management and its affiliates cannot guarantee accuracy. Past performance is not a guarantee of future returns. Performance over periods exceeding 12 months has been annualized.
This content is provided for informational purposes only and is not intended as an offer or solicitation with respect to the purchase or sale of any security. Statements in this report are based on the views of BTC Capital Management and on information available at the time this report was prepared. Rates are subject to change based on market and/or other conditions without notice. This commentary contains no investment recommendations and should not be interpreted as investment, tax, legal, and/or financial planning advice. All investments involve risk, including the possible loss of principal. Investments are not FDIC insured and may lose value.