
The S&P 500 gained more ground this week as markets reacted to the easing of lockdown restrictions across the country. Investors reacted positively to the reopening of their favorite restaurants and stores. Over the week, the index was up 2.20%. This brings year-to-date performance to -5.25%. Strength in the Financial sector, one of the weaker performing sectors year-to-date, led this week’s positive performance. The sector was up 8.96% for the week and all sectors except Information Technology were also up. The Information Technology sector remains the best performing sector year-to-date despite this week’s relatively flat return of -0.56%. These positive returns indicate the market is not anticipating a significant “second wave.” Unfortunately, the markets are not epidemiologists.
Initial unemployment claims for the week ended on May 16 remains high despite a dip from the previous week. New claims were filed by 2.44 million people, a dip from 2.69 million claims the previous week. With the limited openings of businesses, some employees are going back to work. This should have a positive impact on employment numbers.
This week saw several positive economic indications. Consumer confidence, at 86.6 was higher than the previous month’s confidence number of 85.7. This is shy of the expected 88.
We also saw strength in housing. People may be taking advantage of low mortgage rates as 4.33 million existing homes were sold, which is a little higher than the forecasted 4.3 million. There was an increase in new home sales from 22.548 million in March to 25.073 million in April. The expectation was for sales of 24.633 million. Additionally, a higher number of building permits were issued than expected, 1.066 million permits. This compares favorably with the expected 1.035 million.
The Leading Indicators Index dipped again in April, but not as much as in March. The Leading Indicators Index is a composite of 10 leading indicators tracked by the Conference Board. The 4.4% April dip compares to the previous month’s decline of 7.4%.
Manufacturing continues to be weak in May. The Markit PMI Manufacturing Index for May was at 39.8, and a reading less than 50 is considered a negative indicator. The Philadelphia Fed Index number was also low, contracting by 43.1. This index tracks manufacturing conditions in the Third Federal Reserve District. The Dallas Fed Index, tracking manufacturing activity in Texas, declined by 49.2 in May.
 |
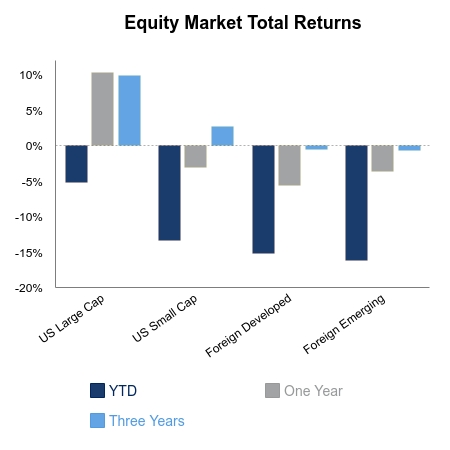 |
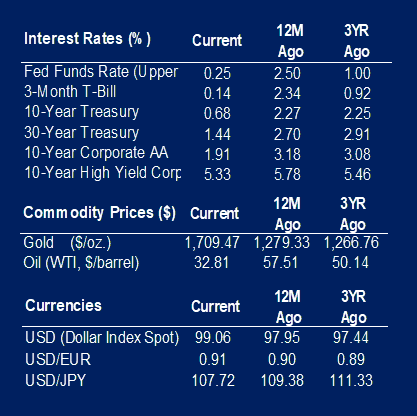
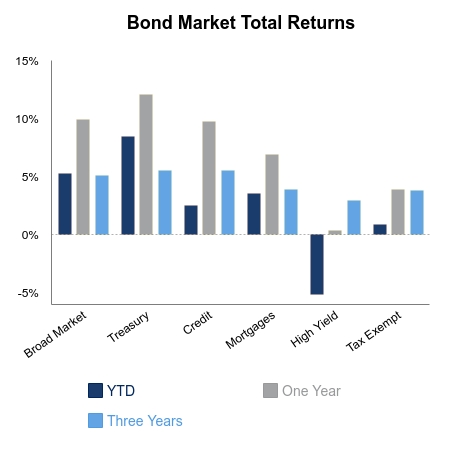
Source: BTC Capital Management, Bloomberg LP, Ibbotson Associates, FactSet.
The information provided has been obtained from sources deemed reliable, but BTC Capital Management and its affiliates cannot guarantee accuracy. Past performance is not a guarantee of future returns. Performance over periods exceeding 12 months has been annualized.
The information within this document is for information purposes only and is not intended as an offer or solicitation with respect to the purchase or sale of any security. Statements in this report are based on the views of BTC Capital Management and on information available at the time this report was prepared. Rates are subject to change based on market and/or other conditions without notice. This commentary contains no investment recommendations and you should not interpret the statement in this report as investment, tax, legal, and/or financial planning advice. All investments involved risk, including the possible loss of principal. Investments are not FDIC insured and may lose value.