
There was a lot of news about the employment picture this week. Unemployment dipped below 5% in September to 4.8%. The expectation was for a 0.1% decrease from August to 5.1%. The total number of unemployed people went down by 710,000 to 7.7 million.
The nonfarm payroll number, on the other hand, came in lower than expected. Fewer jobs were created. The increase of 194,000 is significantly lower than the initial expectation of 488,000. The most notable gains came from increases in leisure and hospitality, professional and business services, retail trade, and transportation and warehousing employment. There was a decline in public education employment.
Labor force participation at 61.6% stayed within its post-pandemic range of 61.4% to 61.7%. We have seen significant decreases in labor force participation for women with a decrease from 57.8% in February 2020 to 55.9% in September 2021. The overall trend for labor force participation has been downward since the Tech Bubble highs of 67.3%.
September was another month of elevated price levels. Consumer prices as measured by the Consumer Price Index (CPI) increased by 0.4% over the month and 5.4% over the year. These increases are 0.1% higher than expected across both measures. The largest increase in the month came from energy and new cars, both were up 1.3%. Taking out energy and food, prices were up 0.2% over the month and 4% over the year.
September’s monthly increase in hourly wages of 0.60% was offset by the increase in CPI, leading to the real earnings increase of 0.2%. The yearly real earnings number, on the other hand, was negative at -0.8%. This reflects the September hourly earnings increase over the previous year of 4.6% and the earlier mentioned CPI increase of 5.4%.
The number of open jobs decreased in September but is still historically high. The 10.4 million open jobs is down from 11.1 million in August. Employers continue to struggle to fill positions. These struggles are reflected in higher work-related incentives. We may continue to see increases in the hourly earnings number as employers try to lure people back into the workforce.
The number of hours worked in the average week has stayed high. September saw workers put in an average of 34.8 hours per week. This is up from February 2020’s 34.40 hours per week but down from January 2021’s peak of 35 hours per week.
 |
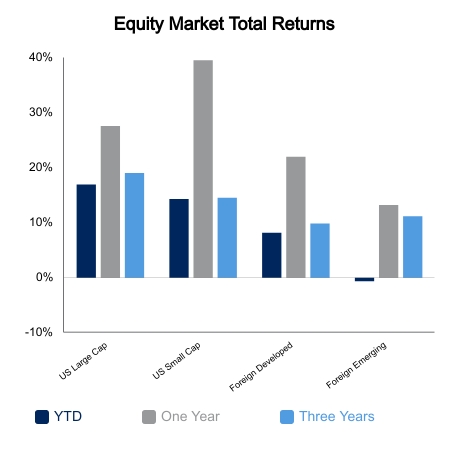 |
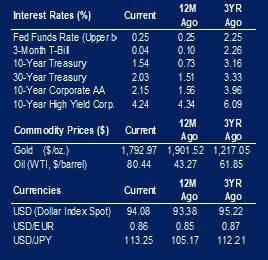
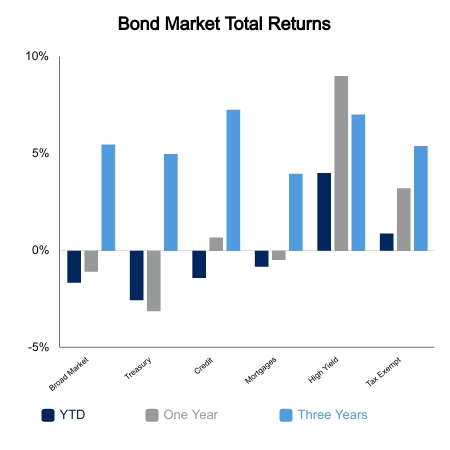
Source: BTC Capital Management, Bloomberg LP, Ibbotson Associates, FactSet, Refinitiv.
The information provided has been obtained from sources deemed reliable, but BTC Capital Management and its affiliates cannot guarantee accuracy. Past performance is not a guarantee of future returns. Performance over periods exceeding 12 months has been annualized.
The information within this document is for information purposes only and is not intended as an offer or solicitation with respect to the purchase or sale of any security. Statements in this report are based on the views of BTC Capital Management and on information available at the time this report was prepared. Rates are subject to change based on market and/or other conditions without notice. This commentary contains no investment recommendations and you should not interpret the statement in this report as investment, tax, legal, and/or financial planning advice. All investments involve risk, including the possible loss of principal. Investments are not FDIC insured and may lose value.