
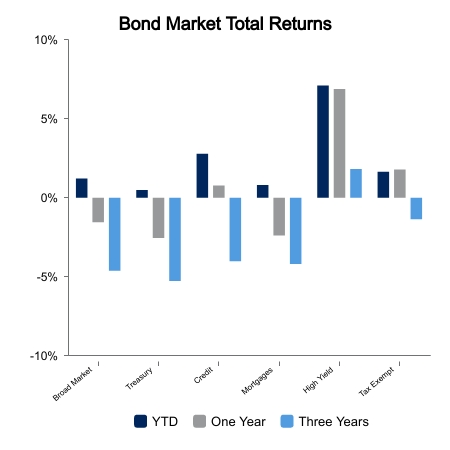
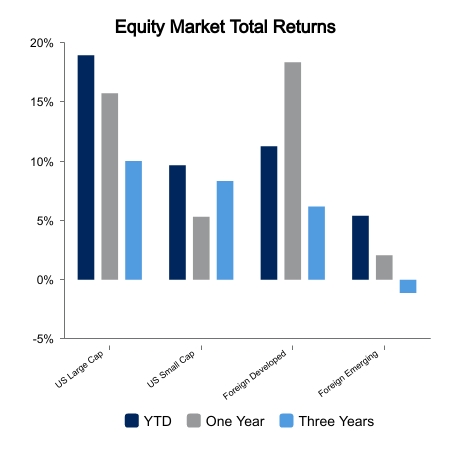
This past week the broad bond market index advanced 1.5%, but August still sits in the deficit column down -0.8%. The yield on a U.S. Treasury 10-year bond declined from 4.32% to 4.11% during the past week as the market reevaluated the prior week’s rise of this benchmark bond to 4.35%, the highest level since 2007. Broad equity market returns as measured by the Russell 3000 Index advanced 3.1% this week on positive news of lower interest rates. Price gains in 10 of 11 of the economic sectors led by the telecom and materials sectors provided signs of a broadening in market leadership after information technology and consumer discretionary sectors dominated in the first half of 2023.
Second Quarter Revisions
The first revision to the estimate of second quarter GDP growth was reduced from 2.4% to 2.1% as downward revisions reflected less inventory and nonresidential fixed investment than initially reported. Durable goods orders declined 5.2% in August after surging 4.4% in July, with large declines in aircraft orders contributing to the change. Weakening growth rates of core capital goods orders and shipments are likely to continue as capital investment spending intentions have reached their lowest levels since June 2020.
Job Market
With the Federal Reserve focused on the impact of labor demand and wage pressure on inflation, this month’s fall in job openings took some pressure off future rate hikes. U.S. job openings fell in July by more than expected to 8.83 million from 9.17 million in June, the Bureau of Labor Statistic’s Job Openings and Labor Turnover Survey, or JOLTS, showed Tuesday. This marked the sixth decline in the last seven months and the lowest figure in two years. The quits rate, which measures voluntary job leavers as a share of total workers, dropped to 2.3%, the lowest since early 2021. This implies workers are less confident in finding another job.
Housing Market
There was brighter news on the housing front as pending home sales for July rose 0.9% compared to the forecast predicting a -1.0% decline. This measure remains 13.8% below last year’s sales activity. Mortgage applications also rose 2.3% last week, but applications remain near 30-year lows as homeowners see little reason to finance at today’s high rates. Home prices climbed 0.7% in June from May, according to data from S&P CoreLogic Case-Shiller. Elevated prices have spurred a supply crunch and higher mortgage costs have combined to make this the most-unaffordable housing market since the 1980s.
 |
 |
Source: BTC Capital Management, FactSet.
The information provided has been obtained from sources deemed reliable, but BTC Capital Management and its affiliates cannot guarantee accuracy. Past performance is not a guarantee of future returns. Performance over periods exceeding 12 months has been annualized.
This content is provided for informational purposes only and is not intended as an offer or solicitation with respect to the purchase or sale of any security. Statements in this report are based on the views of BTC Capital Management and on information available at the time this report was prepared. Rates are subject to change based on market and/or other conditions without notice. This commentary contains no investment recommendations and should not be interpreted as investment, tax, legal, and/or financial planning advice. All investments involve risk, including the possible loss of principal. Investments are not FDIC insured and may lose value.