
The S&P 500 inched up to make a new all-time high. Under the surface, however, things are not so strong with less than 50% of the Index trading above its 50-day moving average. This is a rare feat. Further highlighting this point is the fact that only 30% of the S&P members are outperforming the Index over the last 21 days, which has only occurred on roughly 2% of trading days since 1927. The S&P 500 is also up five consecutive months as well as five consecutive quarters.
Commodities continue to spike despite media attention focusing on falling lumber prices. Grains were up big on Wednesday following the crop report which showed lower than expected plantings. Drought conditions continue to persist in much of the country. Natural gas is up 17% in just over a week to trade at a two-year high as heat warnings stretch across the country. Oil hit a cycle high this week at $74 per barrel despite what would seem to be extremely bearish news as some countries lock down in response to the new delta-variant of COVID-19. Oil prices were aided by a large drawdown in the weekly inventory as well as continued supply constraints in the industry.
Two weeks ago, it was highlighted that shipping costs were surging as the Shanghai to Los Angeles Freight Index was up 50% in two months. In the two weeks since, freight rates have surged another 40% and now sit three times higher than any period in the 10 years prior to the pandemic. Despite rising prices, bond yields continue to move lower as the market continues to view nearly all the price hikes as transitory. Also, the Citi G10 Economic Surprise Index continues to move lower as expectations were too high. It is tough for bond yields to move higher in the face of below consensus economic data, even if it is good on an absolute basis. However, the Index is now 1.3 standard deviations below its one-year average, which is approaching levels where bond yields rise as it becomes easier for economic data to beat lowered expectations.
Based on the above points it is no surprise the NASDAQ and energy equities have led the market in June. The NASDAQ was up 5.6% whereas the Dow Jones Industrial Average was flat. The S&P 500 Energy sector was up 4.6% in June and is now up 45.6% for the year.
 |
 |
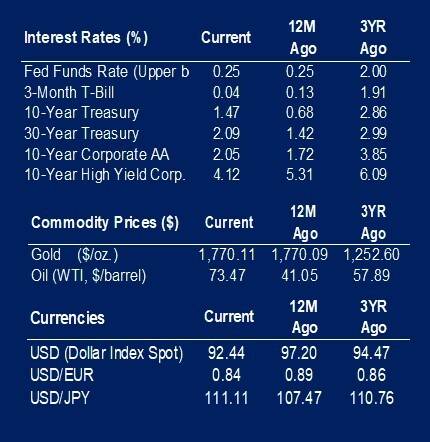
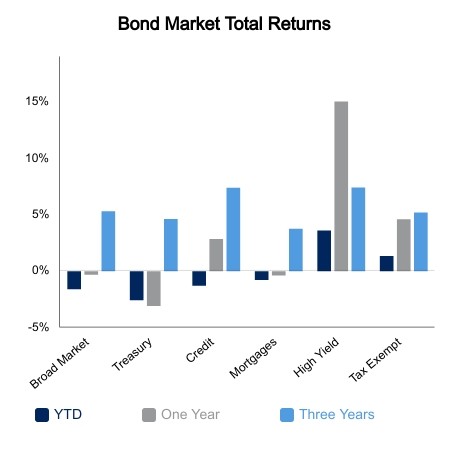
Source: BTC Capital Management, Bloomberg LP, Ibbotson Associates, FactSet, Refinitiv.
The information provided has been obtained from sources deemed reliable, but BTC Capital Management and its affiliates cannot guarantee accuracy. Past performance is not a guarantee of future returns. Performance over periods exceeding 12 months has been annualized.
The information within this document is for information purposes only and is not intended as an offer or solicitation with respect to the purchase or sale of any security. Statements in this report are based on the views of BTC Capital Management and on information available at the time this report was prepared. Rates are subject to change based on market and/or other conditions without notice. This commentary contains no investment recommendations and you should not interpret the statement in this report as investment, tax, legal, and/or financial planning advice. All investments involve risk, including the possible loss of principal. Investments are not FDIC insured and may lose value.