
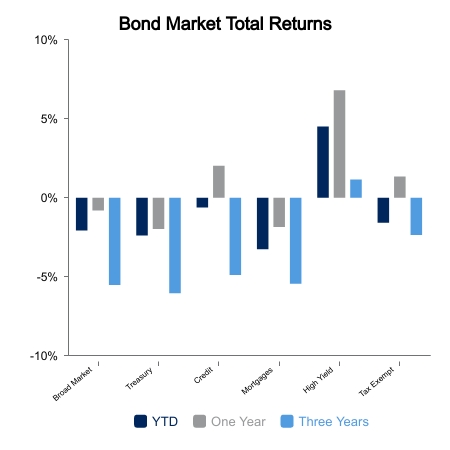
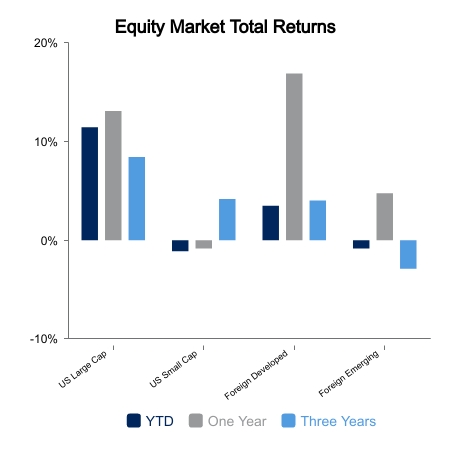
This past week the broad bond market index advanced 1.0%, but the month-to-date result for October remains just slightly positive at 0.1%. This follows a week where bonds fell 1.2% as the yield on a U.S. Treasury 10-year bond traded in a range between 4.54% to 4.89%. Rates were pushed higher due to concerns about the impact on fiscal policy from a potential government shutdown along with growing levels of Treasury debt issuance. Rates moved lower after Monday’s bond market holiday close as investors sought out safe haven bonds following a changing political dynamic in the Middle East. Broad equity market returns as measured by the Russell 3000 Index advanced 3.2% this week led by utilities. This followed a six-month period where this sector was the market’s biggest laggard. Technology was close behind at 4.2% as this segment continues to be this year’s leader, after being last year’s laggard. Year-to-date six of the 11 sectors that comprise the Russell 3000 remain negative reflecting the lack of breadth seen in the markets this year.
As earnings releases start pouring in this week, they will guide markets on how strong the past quarter’s economic growth has been and what the fourth quarter will potentially be. A 3.0% annualized projected third quarter U.S. GDP rate is the highest post pandemic recovery rate since fourth quarter 2021. Supporting that GDP growth projection was a surprisingly strong headline non-farm payrolls (NFP) increase of 336,000 jobs in September (vs. August’s upwardly revised 227,000). This surpassed estimates of 170,000 provided by an estimate from Bloomberg. The NFP two-month net revision was 119,000. However, the household survey portrayed a much weaker labor market with employment in that survey advancing 86,000 for September. The unemployment rate remained at 3.8% as advancement of Average Hourly Earnings month-over-month slowed to a 2.4% annualized rate while still reflecting wages up 4.2% over the last year.
ISM Services survey showed a pullback in new orders, indicating a softer outlook as the index cooled to 53.6 (vs. 54.5 prior). Down were new orders (-5.7%), inventories (-3.5%) and employment (-4.3%) as businesses became comfortable holding lower inventories due to improved supply chains while being cautious on their outlook for slower consumer spending considering recent higher food and energy costs. Prices paid to U.S. Producers as measured by the Producer Price Index advanced 0.5% this month. Excluding food and energy prices came in hotter than expected with a 0.3% rise for the month, the third consecutive monthly increase.
 |
 |
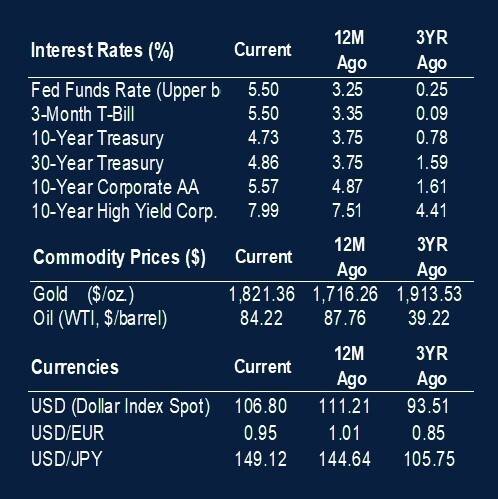
Source: BTC Capital Management, FactSet Financial Data and Analytics
The information provided has been obtained from sources deemed reliable, but BTC Capital Management and its affiliates cannot guarantee accuracy. Past performance is not a guarantee of future returns. Performance over periods exceeding 12 months has been annualized.
This content is provided for informational purposes only and is not intended as an offer or solicitation with respect to the purchase or sale of any security. Statements in this report are based on the views of BTC Capital Management and on information available at the time this report was prepared. Rates are subject to change based on market and/or other conditions without notice. This commentary contains no investment recommendations and should not be interpreted as investment, tax, legal, and/or financial planning advice. All investments involve risk, including the possible loss of principal. Investments are not FDIC insured and may lose value.