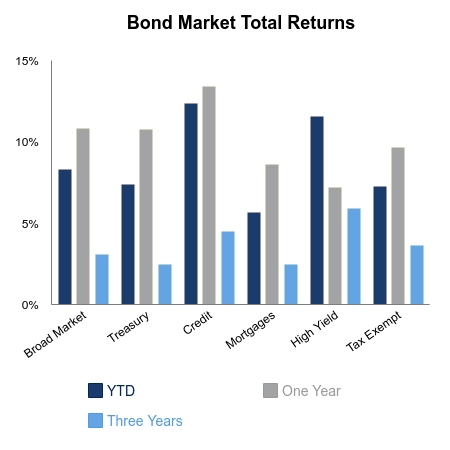
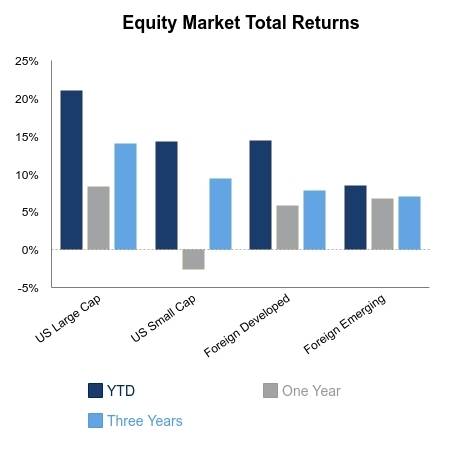
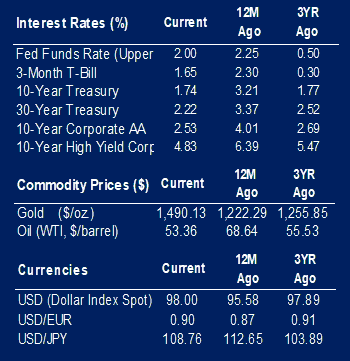
This week has given us positive moves in equity markets. The S&P 500 is up 1.77%. This strong move comes as we see a slight sliver of light in the tunnel that is the Sino-American trade negotiations. Talks seem to be moving in the right direction as we passed the October 15 deadline with no tariff increase. The Chinese have also indicated there may be increased purchases of U.S. farm products.
A contributing factor to this week’s positive returns is that yet another earnings season is upon us. Equity markets, as usual, are hoping for the gift of earnings and sales growth. Unfortunately, hope is not a strategy. The expectation for the third quarter is for earnings to contract by 5% as of Wednesday. So far, with 64 S&P 500 companies reporting, earnings growth is 2.83% better than expected. Sales growth expectations for the third quarter, as of yesterday, are close to 3%. The surprise here is 1.09%.
In macroeconomic news, retail sales came in lower than expected. Retail sales were down 0.30% in September. That is after growth of 0.60% in the previous month. E-commerce, which has led a lot of the retail growth this year was down 0.3%. Auto and building material sales contributed to the decline. Fortunately, a single number does not an economy make.
The Empire State Index number for September came in at 4. This is better than the expected 0.80. The index is a monthly survey of manufacturers in New York state conducted by the Federal Reserve Bank of New York. Readings over 0 are generally indicative of economic expansion.
Manufacturing production on the other hand, was down in September. The month saw a decrease in production by 0.48% from the previous month. The Manufacturing Production Index measures real output in manufacturing.
Consumer sentiment, as measured by the University of Michigan, came in at 96.0. This reading is better than the previous month’s number of 93.2 and the expected 92. Consumers continue to be the driving force in U.S. GDP growth.
We are seeing increased optimism among home builders. The NAHB Housing Market Index for October is at 71.0. This is better than the previous month’s 68. The index is a survey of home builders.
 |
 |

Contributed by | Kuuku Saah, CFA, Investment Analyst
Kuuku is an Investment Analyst at BTC Capital Management with nine years of investment management experience. Kuuku’s primary responsibilities include portfolio management and analysis. Kuuku attended Drake University and double-majored in finance and economics. He is a holder of the right to use the Chartered Financial Analyst® designation.
Source: BTC Capital Management, Bloomberg LP, Ibbotson Associates, FactSet.
The information provided has been obtained from sources deemed reliable, but BTC Capital Management and its affiliates cannot guarantee accuracy. Past performance is not a guarantee of future returns. Performance over periods exceeding 12 months has been annualized.
The information within this document is for information purposes only and is not intended as an offer or solicitation with respect to the purchase or sale of any security. Statements in this report are based on the views of BTC Capital Management and on information available at the time this report was prepared. Rates are subject to change based on market and/or other conditions without notice. This commentary contains no investment recommendations and you should not interpret the statement in this report as investment, tax, legal, and/or financial planning advice. All investments involved risk, including the possible loss of principal. Investments are not FDIC insured and may lose value.

