
Bond Yields Continue to Push Higher Amid Strong Economic Data
Equities were down modestly on the week as higher bond yields acted as a headwind. The historical association of higher yields hurting growth stocks has not transpired as of late.
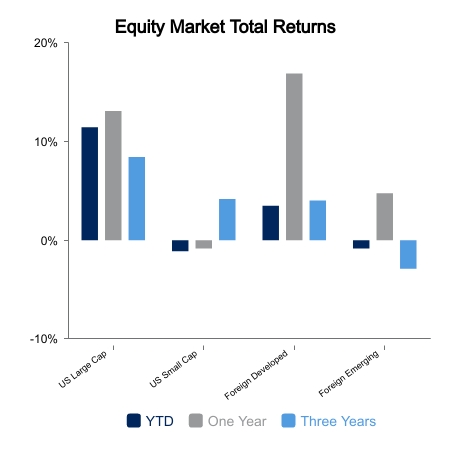
- The NASDAQ was up 1.1% on the week.
- Small caps lost 2.7%.
- The S&P 500 split the difference and was down only 0.2%.
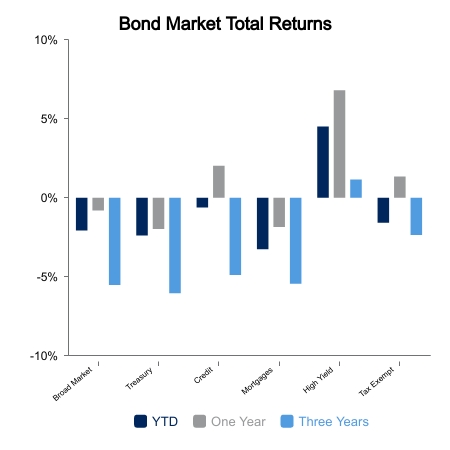
- Core bonds were down 0.6%.
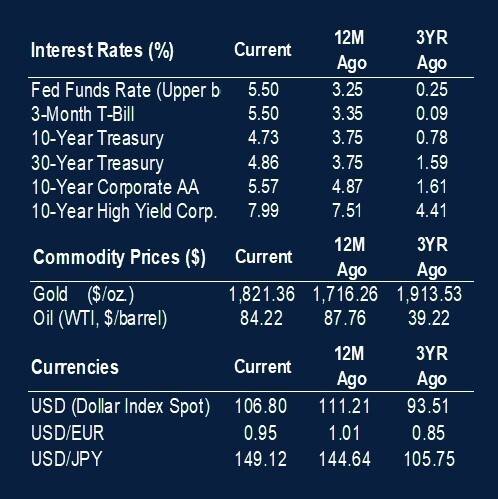
Year-to-date, 10-year Treasury yields have risen more than 85 basis points. Real yields, which is a more important factor in its economic impact, have moved up by 82 basis points. Historically, this would have been a major headwind to growth equities as valuation is supposed to come in when yields rise. Instead, the higher valuation NASDAQ is up 27% whereas small caps are down.
Utilities were the highlight this week as they fell nearly 5% in one session. They just completed a six-day skid of more than 10% relative to the S&P 500. It was the largest six-day decline relative to the S&P 500 since 2002. Also of note is oil prices, which steady rose to $93 per barrel, but then fell $10 in five sessions. This resulted in a sharp 7% weekly decline in energy equities.
Economic Data Remains Resilient
Economic data was generally better than expected, which helped bond yields jump higher. The key datapoints continue to be anything related to employment. Jobless claims continue to print near historic lows of 200,000 per week. The Job Openings and Turnover Survey showed a big jump in job openings. ADP reported employment gains of 89,000, which was finally a miss versus expectations and allowed bond yields to have at least one day of reprieve. There appears to be an embedded reaction function in markets that if jobs don’t start moderating immediately, then yields will go higher and equities will go down. We may be returning to the environment where bad economic news is good equity news.
ISM Manufacturing was better than expected with a reading of 49.0, which was the third straight monthly increase. The ISM employment component is up to 51.2 versus 44.4 just two months ago. This doesn’t support weakening employment in the cyclical goods area, which is historically where most of the job losses occur in a recession. The only exception to this was 2008, which was financial centric. ISM new orders were up to 49.2, their highest reading in more than a year.
 |
 |
Source: BTC Capital Management, FactSet.
The information provided has been obtained from sources deemed reliable, but BTC Capital Management and its affiliates cannot guarantee accuracy. Past performance is not a guarantee of future returns. Performance over periods exceeding 12 months has been annualized.
This content is provided for informational purposes only and is not intended as an offer or solicitation with respect to the purchase or sale of any security. Statements in this report are based on the views of BTC Capital Management and on information available at the time this report was prepared. Rates are subject to change based on market and/or other conditions without notice. This commentary contains no investment recommendations and should not be interpreted as investment, tax, legal, and/or financial planning advice. All investments involve risk, including the possible loss of principal. Investments are not FDIC insured and may lose value.