
What A Difference …
Equity investors have been surprised with the year‑to‑date performance of broad equity markets. Do you recall that a year ago investors were lamenting over the performance of equities for all of 2022? At that time, there were no hiding places and the outlook for equities was dismal.
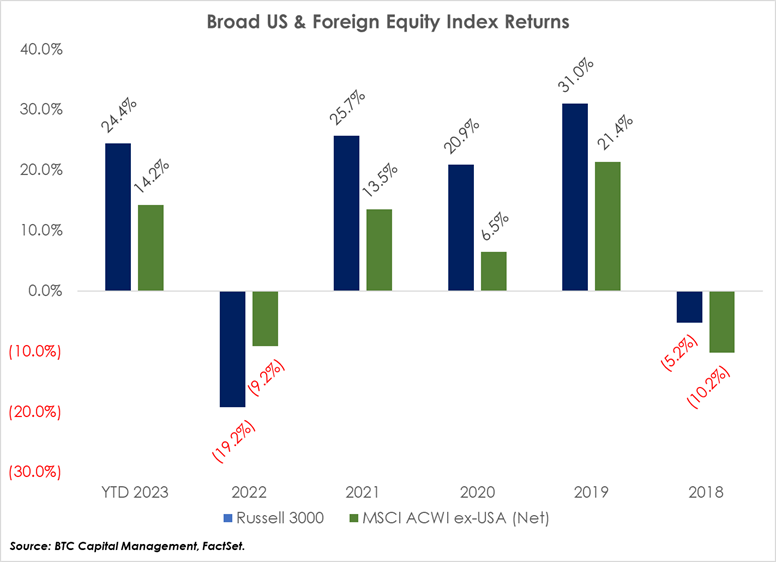
Following the worst performance since 2008, exhibited by broad equity indexes, equity markets have staged a surprising rebound during 2023. U.S. equities, as measured by the Russell 3000 Index, have risen 24.4% year‑to‑date. Foreign equities have also surprised as the MSCI All Country World Index (ACWI) ex-USA has advanced 14.2% year‑to‑date.
At the beginning of 2023 strategists anticipated higher interest rates, challenges to corporate earnings, and higher volatility. Defensive sectors, such as Consumer Staples and Health Care, were recommended given the anticipation of continued weakness in the equity markets and foreign equity markets were anticipated to outperform domestic equity markets.
While interest rates rose throughout most of 2023, it appears this trend reversed recently with the U.S. 10‑Year Treasury yielding 3.95%, which is materially below its high of 4.99% as of Oct. 10. Corporate earnings for the first three quarters of 2023 surprised relative to analyst estimates. Volatility, as measured by the CBOE Volatility Index, declined during 2023 (except for the spike attributed to bank failures in March). U.S. equities have outperformed foreign equities year‑to‑date, as mentioned above.
The impact of these scenarios was either not realized or muted. Rather than defensive sectors, the best performing sectors throughout most of 2023 have been Communication Services, Consumer Discretionary, and Information Technology. This was driven by the outsized contribution attributed to the companies characterized as the “Magnificent Seven.” This includes Apple (AAPL), Microsoft (MSFT), Google parent Alphabet (GOOGL), Amazon.com (AMZN), NVIDIA (NVDA), Meta Platforms (META), and Tesla (TSLA).
Opportunity or Head-Fake?
Recent moves in the equity markets, specifically within the U.S., have been driven by tailwinds of an economic soft-landing, coupled with the potential for interest rate cuts by the Fed during 2024. More so, the perception that the “earnings recession” is behind us.
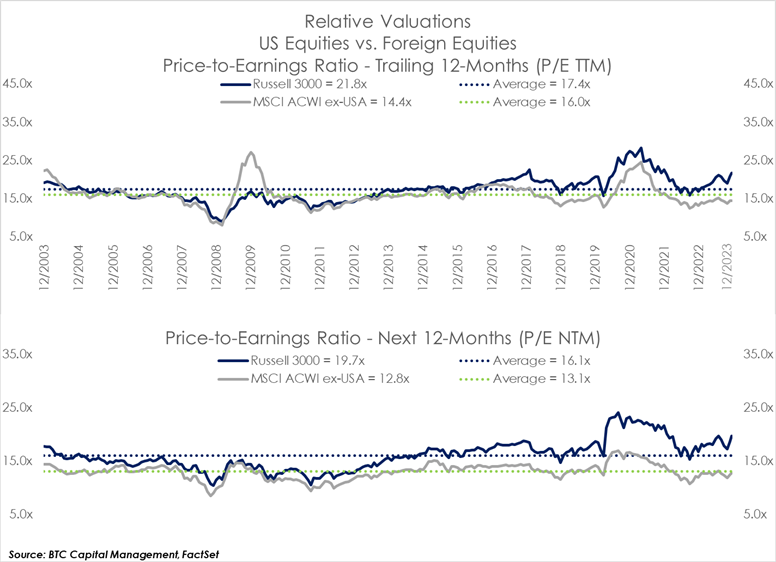
Valuations during 2023 have been a subject of unease. Currently, the Russell 3000 Index trades at a price‑to‑earnings ratio for the trailing 12‑month (P/E TTM) of 21.8x. This is above its 20‑year historical average of 17.4x. Conversely, the MSIC ACWI ex-USA Index currently trades at 14.4x P/E TTM, which is below its historical average of 16.0x of the past 20 years.
When considering valuations covering the next 12‑months price‑to‑earnings ratio (P/E NTM), the Russell 3000 trades at 19.7x, which is above its historical average of 16.1x. The MSCI ACWI ex-USA Index currently trades at a P/E NTM of 12.8x, near its 20‑year average of 13.1x.
Given these valuation levels, what might one expect going forward? Concerning U.S. equities, we inventoried monthly valuations (P/E TTM) from January 1973-November 2022 and determined the corresponding subsequent 12‑month return (note the following scatterplot). Intuitively one may ascertain lower valuations result in the potential for higher subsequent returns and that, as valuations rise, the incident of higher returns over the subsequent 12‑months may decline.
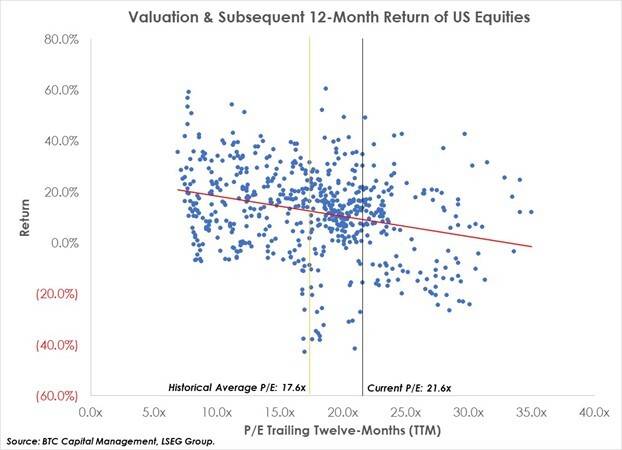
That said, numerous instances of equity return greater than 10% occurred where valuations exceeded the historical average of 17.6x.
We then looked at valuation quartiles and their associated returns. Note the following chart in which we present valuation quartiles (P/E TTM) and subsequent returns (average, median, minimum, and maximum).
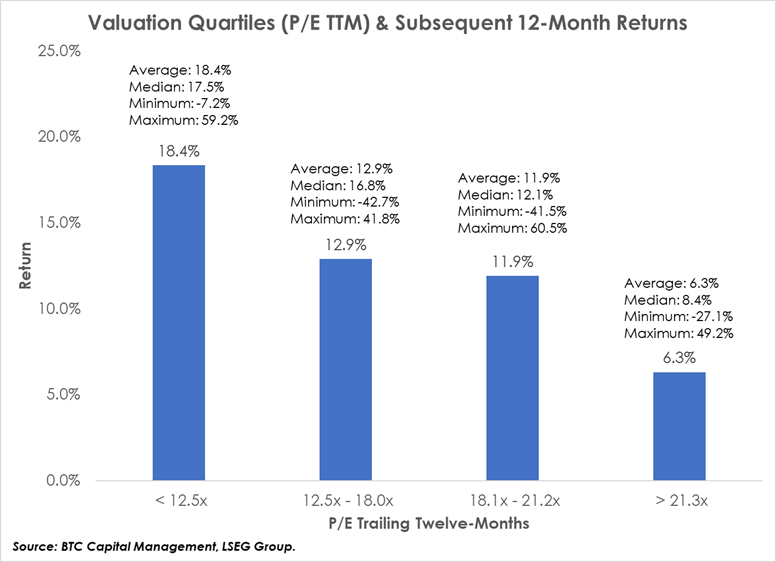
When considering valuations greater than 18.1x, 303 (or 50.6%) of the total observations fall into this range of which 234 exhibited positive returns in the subsequent 12‑months, averaging 16.2% with a median return of 11.4%.
Note the last available 12-month period began November 2022. At that time, U.S. equities traded at 21.4x P/E TTM. Over the subsequent 12-months, U.S. equities exhibited positive performance of 13.5%, well above the average presented in the fourth quartile above.
While we’re not suggesting that 2024 will result in double‑digit positive returns, history suggests that valuation alone should not drive allocation or selection.
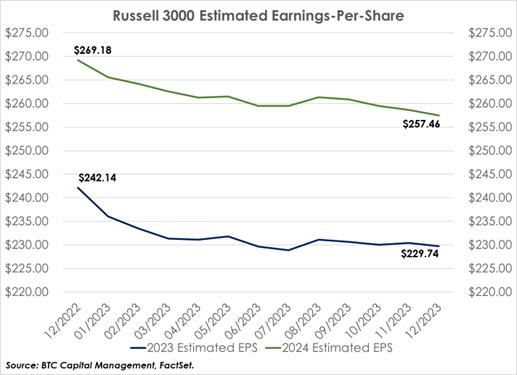
Given the current tailwinds, analysts are optimistic regarding corporate earnings. According to FactSet, 2024 calendar‑year earnings‑per‑share (EPS) for the Russell 3000 Index are estimated at $257.46, which implies year‑over‑year (YOY) growth of 12.1%. This is a material advance over the projected EPS growth rate of 1.5% for calendar year 2023. Supporting this projected growth in EPS are expanding margins and sales. The latter which is projected to grow 5.1% YOY, more than double the 1.2% projected for all of 2023.
|
|
|
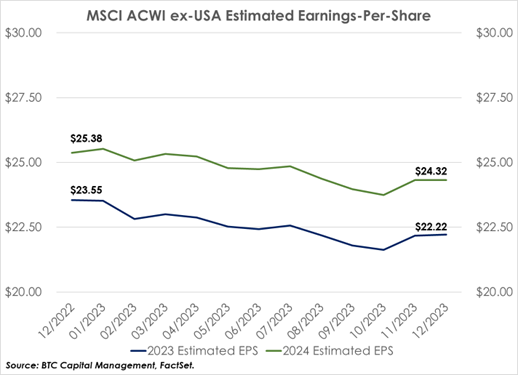
Outside the U.S., EPS for the MSIC ACWI ex-USA Index is expected to grow 9.4% YOY in 2024 to $24.32 (constant currency) versus a contraction of 2.1% estimated for calendar year 2023. Similar to the U.S., margins are expected to expand with sales estimated to grow 4.4% YOY versus. 1.0% estimated for calendar‑year 2023.
Risk-On or Risk-Off
It appears that 2023 will end driven by a “risk-on” framework. Current scenarios of a soft‑landing, stable employment and strong consumer spending are accelerating equity valuations and returns. This sentiment can quickly change to a “risk-off” scenario, similar to what we saw during October should certain events manifest. Specifically, if employment (thus consumer spending) weakens, monetary policy decisions that differ from current expectations, all in the face of an election year for the U.S. Similar to our take in last year’s publication, a “fluid environment” is expected for 2024.
Source: BTC Capital Management, FactSet, LSEG Group
The information provided has been obtained from sources deemed reliable, but BTC Capital Management and its affiliates cannot guarantee accuracy. Past performance is not a guarantee of future returns. Performance over periods exceeding 12 months has been annualized.
This content is provided for informational purposes only and is not intended as an offer or solicitation with respect to the purchase or sale of any security. Statements in this report are based on the views of BTC Capital Management and on information available at the time this report was prepared. Rates are subject to change based on market and/or other conditions without notice. This commentary contains no investment recommendations and should not be interpreted as investment, tax, legal, and/or financial planning advice. All investments involve risk, including the possible loss of principal. Investments are not FDIC insured and may lose value.