
Welcome to Five in Five, a monthly publication from the Investment Team at BTC Capital Management. Each month we share graphs around five topics that illustrate the current state of the markets, with brief commentary that can be absorbed in five minutes or less. We hope you find this high-level commentary to be beneficial and complementary to Weekly Insight and Investment Insight.
This month’s Five in Five covers the following topics:
- The Bank of Japan Fuels Treasury Sell-Off
- Total Light Vehicle Sales
- Monthly Flows by Asset Type
- Fed Model – Equity Valuation
- Second Quarter GDP Exceeds Expectations
1. The Bank of Japan Fuels Treasury Sell-Off
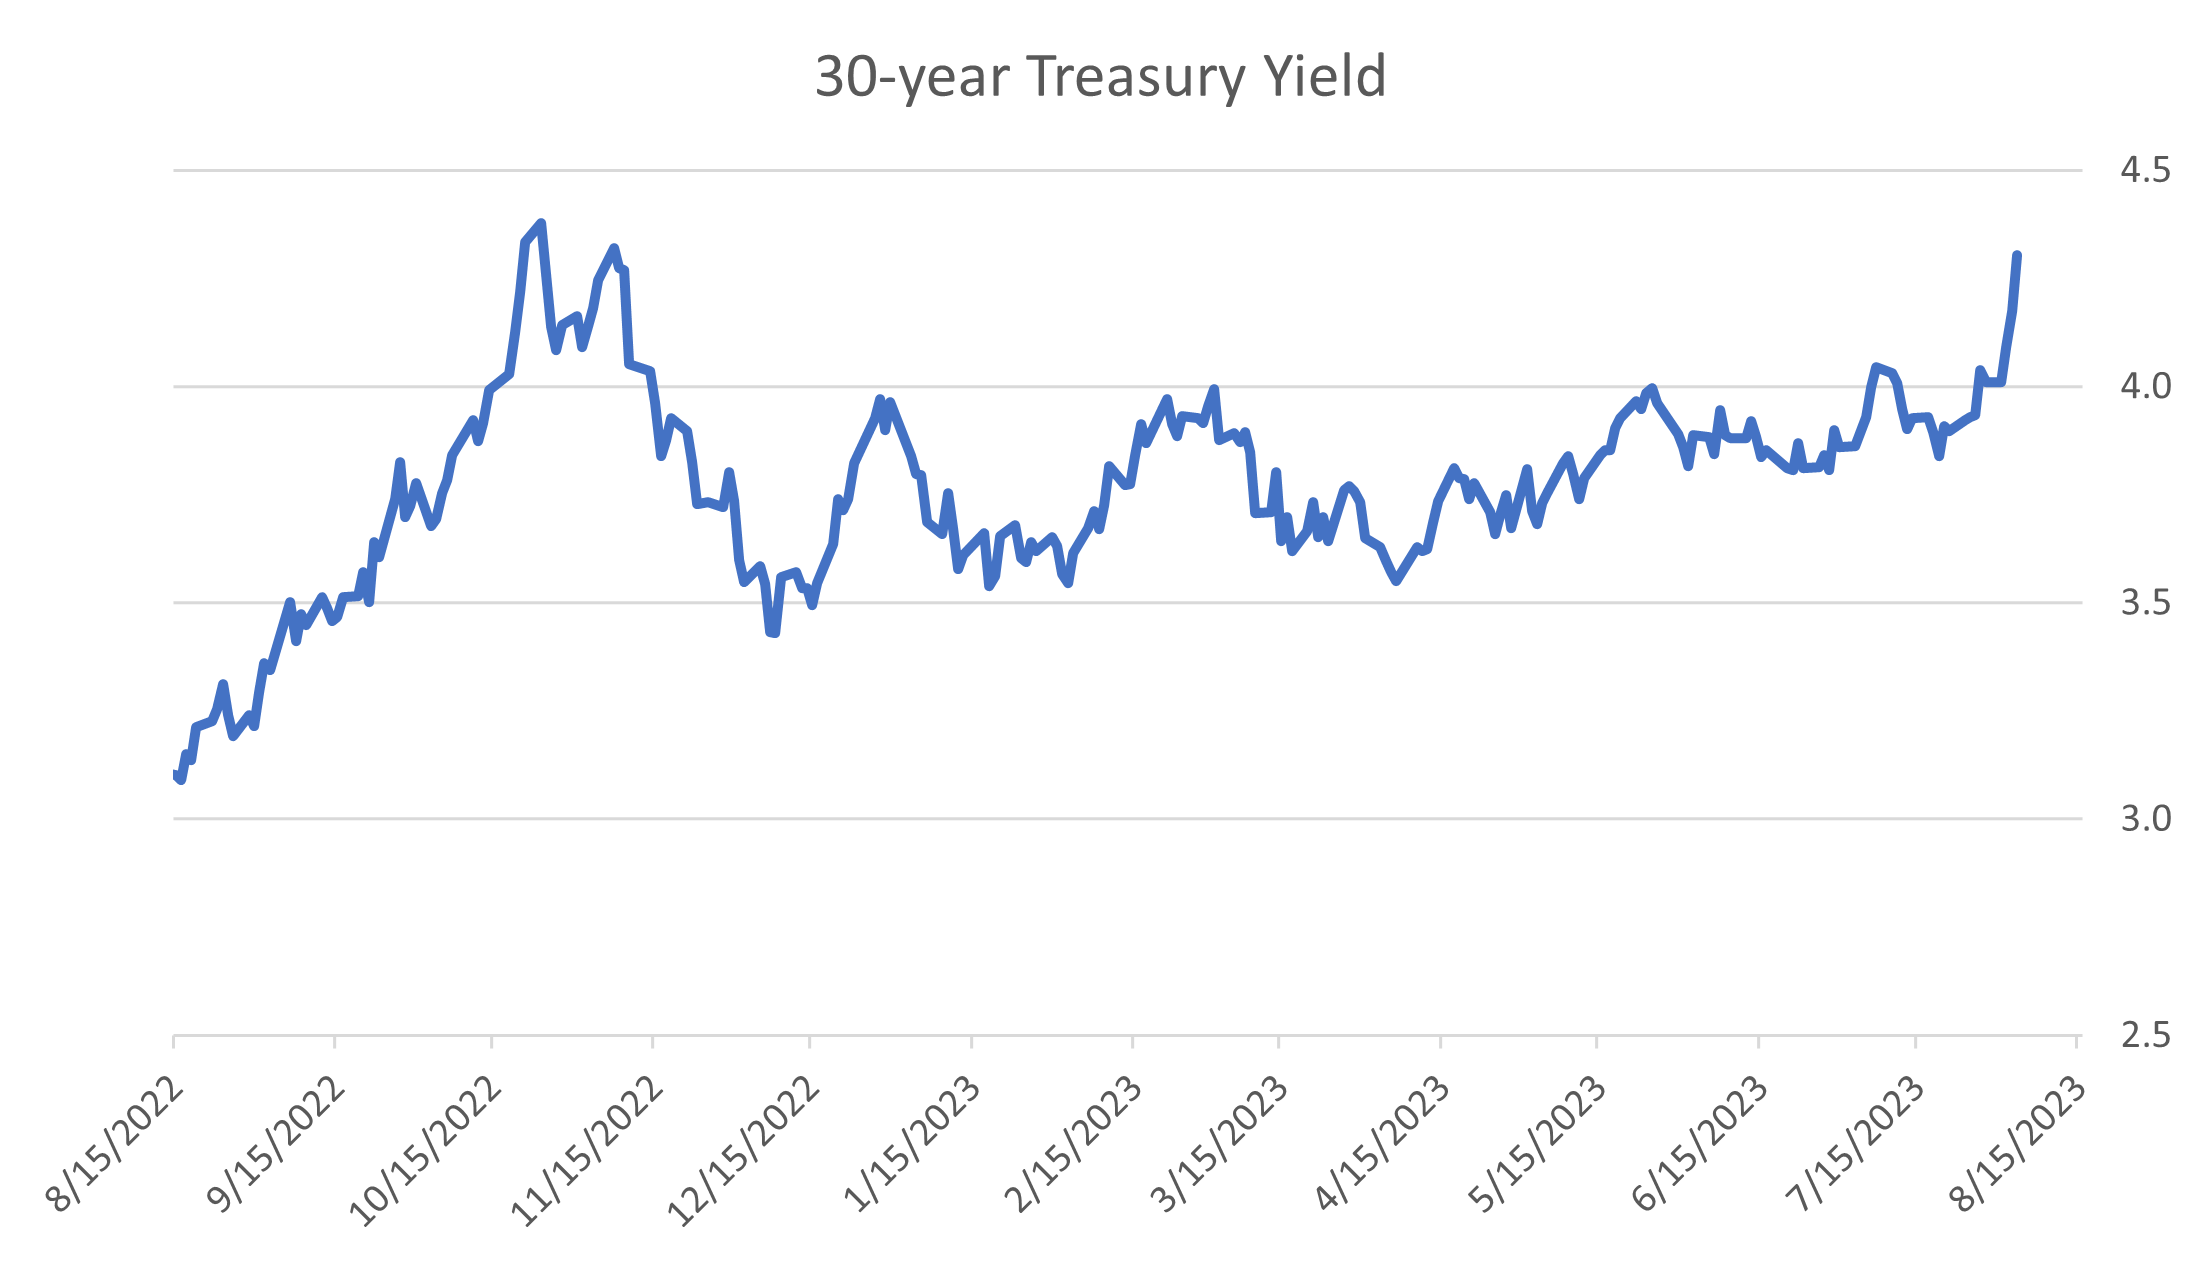
- The Bank of Japan tweaked their yield curve control by widening the upper limit from 0.5% to 1.0%.
- They quickly intervened to limit the speed of the move. The yield is currently around 0.65%.
- U.S. bond yields have moved sharply higher in recent days, especially longer dated maturities.
- Fitch downgraded the U.S. credit rating from AAA to AA+.
- The term premium remains negative but has moved up sharply in recent weeks.
2. Total Light Vehicle Sales
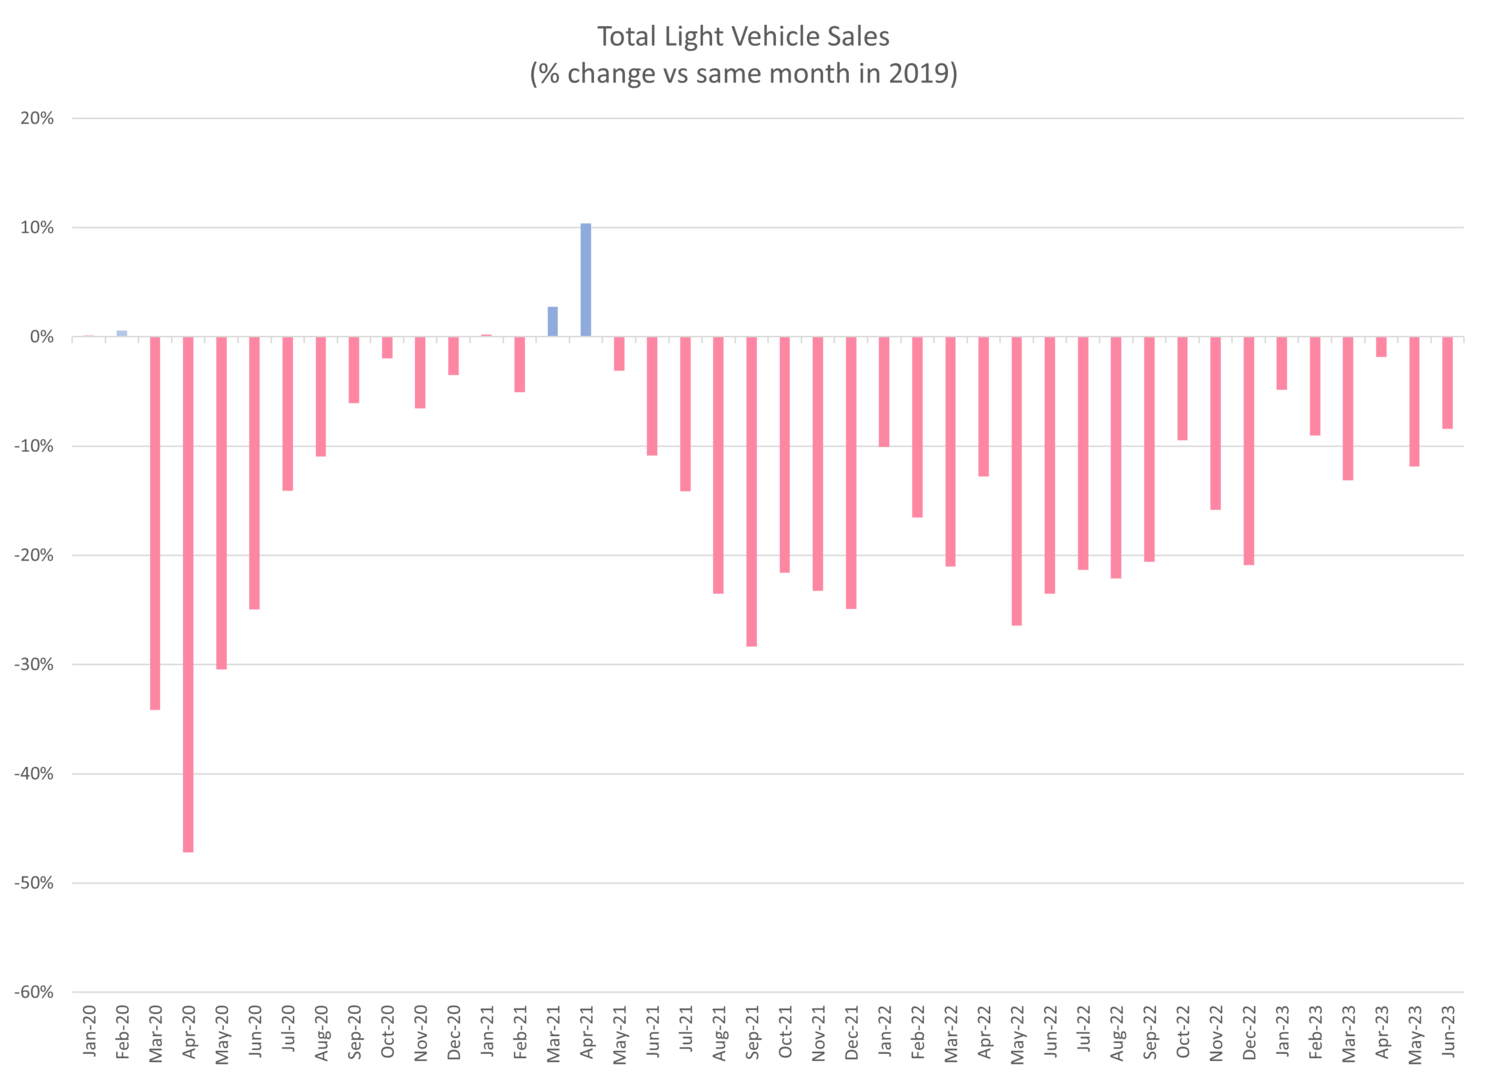
- With the exception of a small number of months, monthly vehicle sales are lower to various degrees when compared to the same month pre-Covid in 2019.
- The auto industry and consumers are facing several obstacles including higher interest rates, lofty sticker prices, chip shortages, and other supply chain issues.
- Despite these challenges, vehicle sales have been improving recently and are closing the gap vs. 2019 sales levels.
3. Monthly Flows by Asset Type
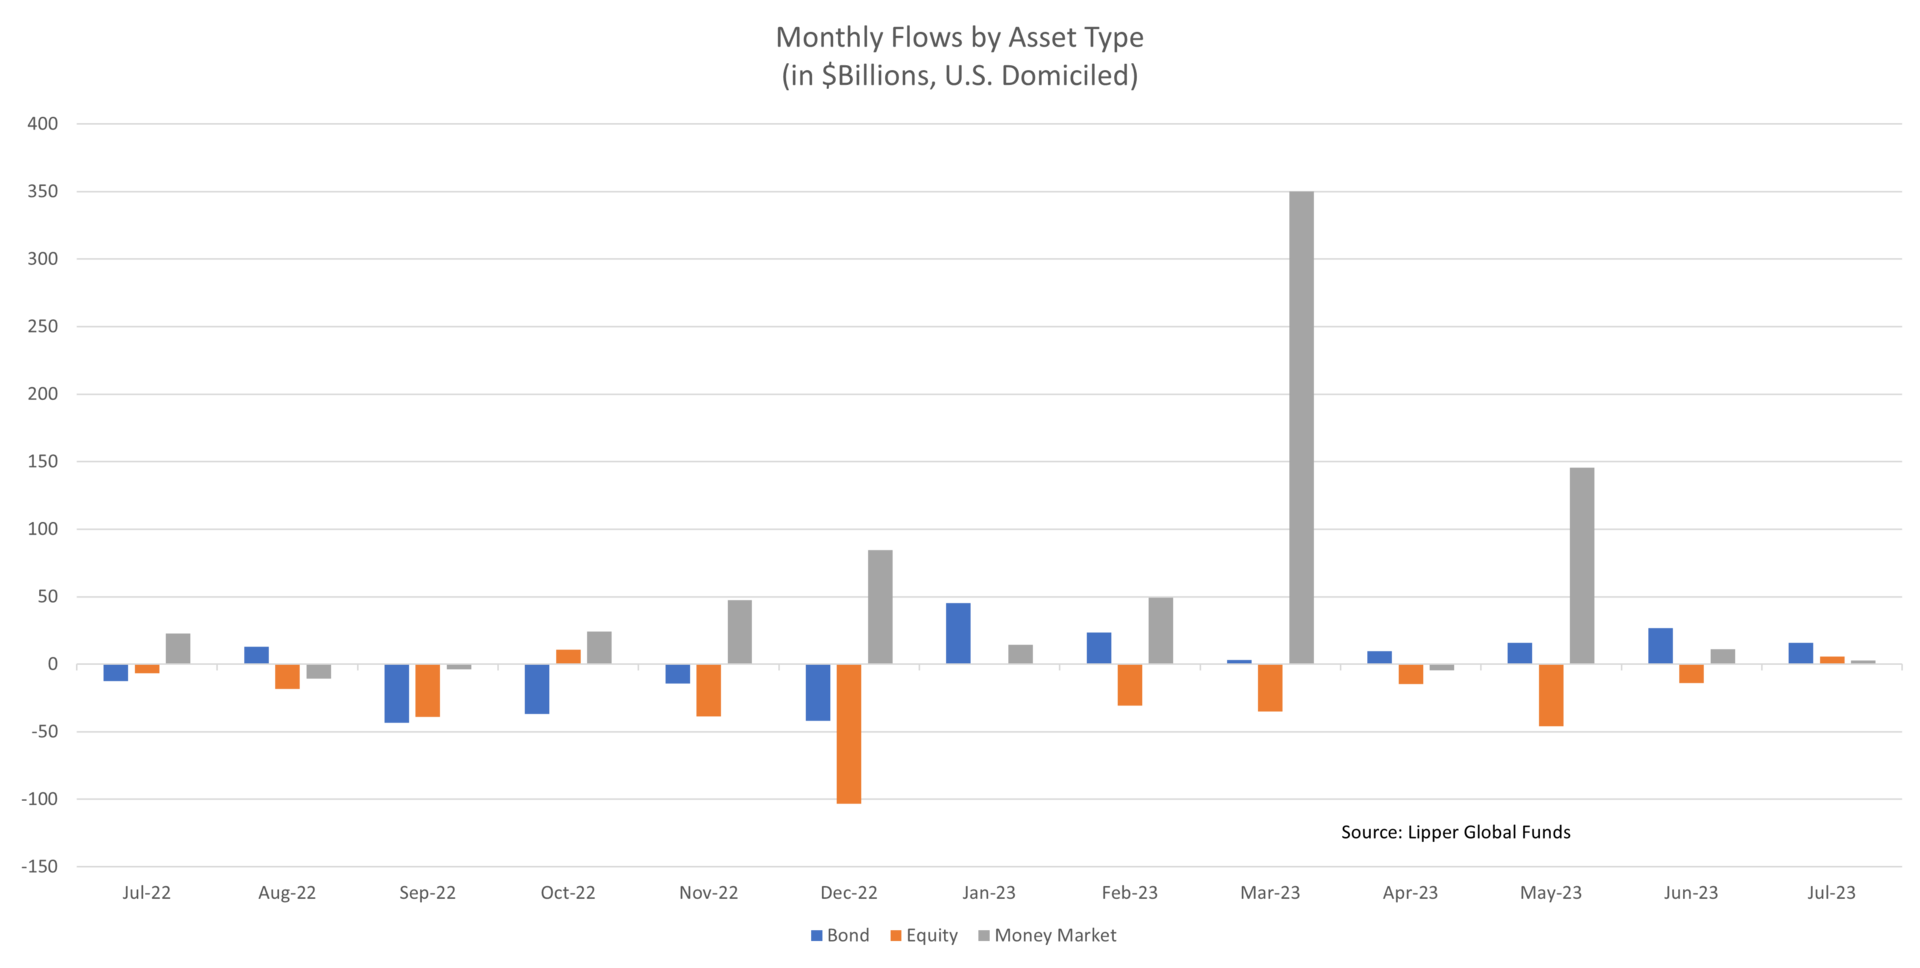
- The last 12 months has seen significant monthly flows into money market funds as investors look to de-risk their investments in addition to taking advantage of multi-decade high yields, despite strong returns in the equity markets.
- Bond funds have also seen monthly inflows year-to-date as yields, including government treasury bonds, are currently yielding multi-decade highs.
- Equity funds have primarily seen monthly outflows despite rallying significantly since October 2022.
4. Fed Model – Equity Valuation
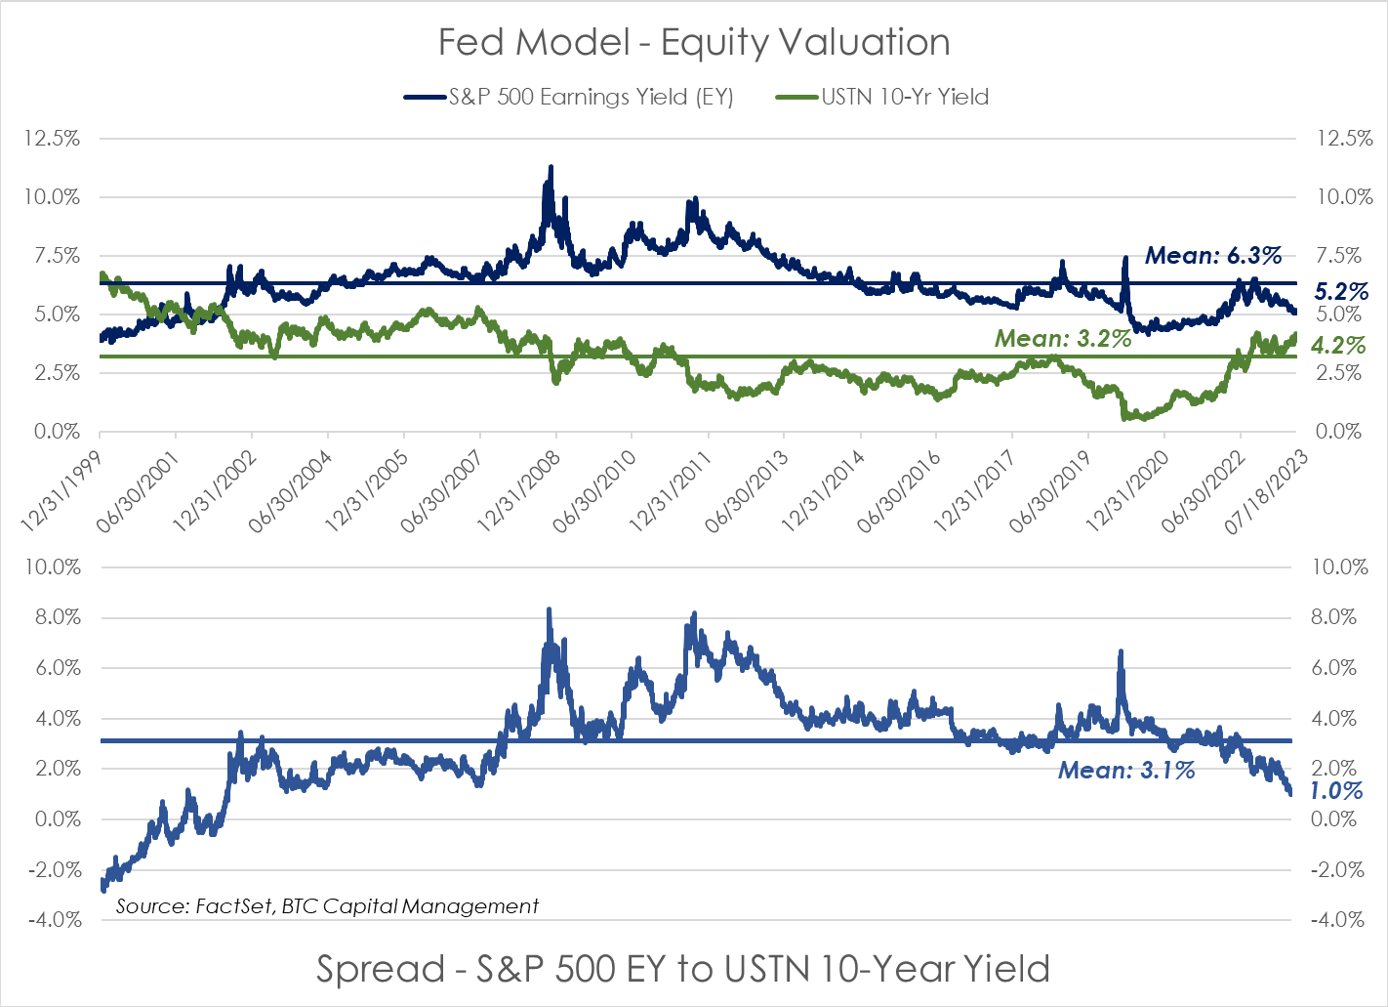
- The Fed Model (top chart) compares the earnings yield (EY), the inverse of the S&P 500 price-to-earnings ratio (P/E), relative to the 10-year Treasury yield.
- The spread between the two indicates relative valuation of equities vs. Treasuries. (bottom chart)
- The spread between the two is currently at its lowest level since the third quarter of 2001 indicating the equity markets are compensating investors relatively less than previously for investing in equities compared to investing in Treasuries.
- The expansion in the P/E multiple as opposed to earnings growth in the equity markets has led to this multi-decade low in the spread.
5. Second Quarter GDP Exceeds Expectations
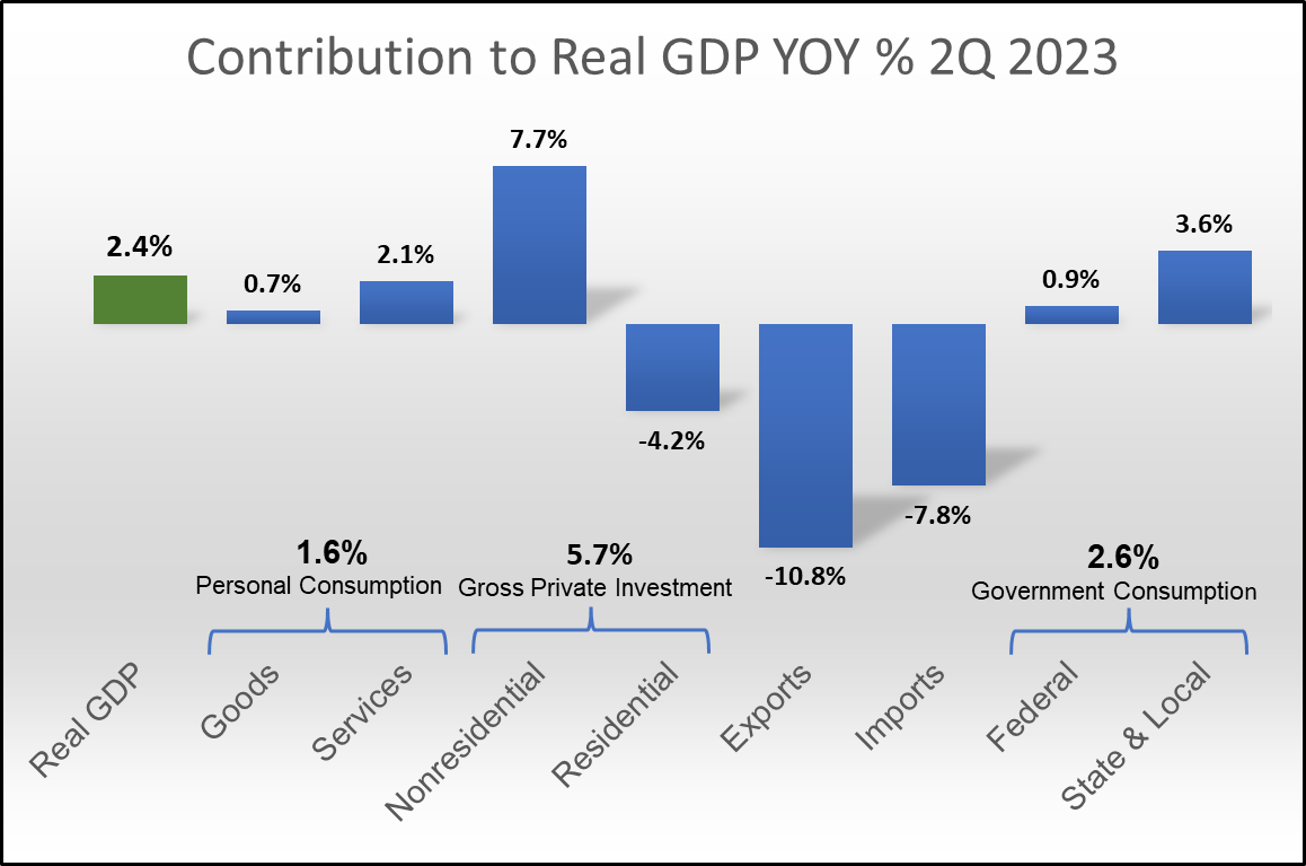
- The first preliminary estimate of second quarter GDP registered 2.4%, higher than the expected level of 1.5%. (FactSet Composite)
- Consumers continued to show their resilience as personal consumption rose by 1.6%. While lower than the 4.2% increase for the first quarter, the 1.6% was higher than expected.
- Capital expenditures were a strong contributor as evidenced by their increase of 7.7% for the quarter. Underlying contributors included structures, equipment, and intellectual property.
- Residential construction continued to be a drag on economic growth (-4.2%) despite a steady increase in new home sales since bottoming a year ago.
- Government spending rose less than in the first quarter but still made a meaningful contribution to the second quarter result.
Sources: BTC Capital Management, Bloomberg Finance L.P., St. Louis Federal Reserve, Lipper Global Funds, FactSet, Bureau of Economic Analysis
The information provided has been obtained from sources deemed reliable, but BTC Capital Management and its affiliates cannot guarantee accuracy. Past performance is not a guarantee of future returns. Performance over periods exceeding 12 months has been annualized.
This document is intended for informational purposes only and is not an offer or solicitation with respect to the purchase or sale of any security. Statements in this report are based on the views of BTC Capital Management and on information available at the time this report was prepared. Rates are subject to change based on market and/or other conditions without notice. This commentary contains no investment recommendations and you should not interpret the statement in this report as investment, tax, legal, and/or financial planning advice. All investments involve risk, including the possible loss of principal. Investments are not FDIC insured and may lose value.