
Welcome to Five in Five, a monthly publication from the Investment Team at BTC Capital Management. Each month we share graphs around five topics that illustrate the current state of the markets, with brief commentary that can be absorbed in five minutes or less. We hope you find this high-level commentary to be beneficial and complementary to Weekly Insight and Investment Insight.
This month’s Five in Five covers the following topics:
- Treasury Yields
- Core Bond Asset Class Performance
- Earnings Growth in Line with Long-term Average
- Magnificent 7 Skewing S&P 500 P/E
- Fiscal Policy Correlation with Stock Prices
1. Treasury Yields
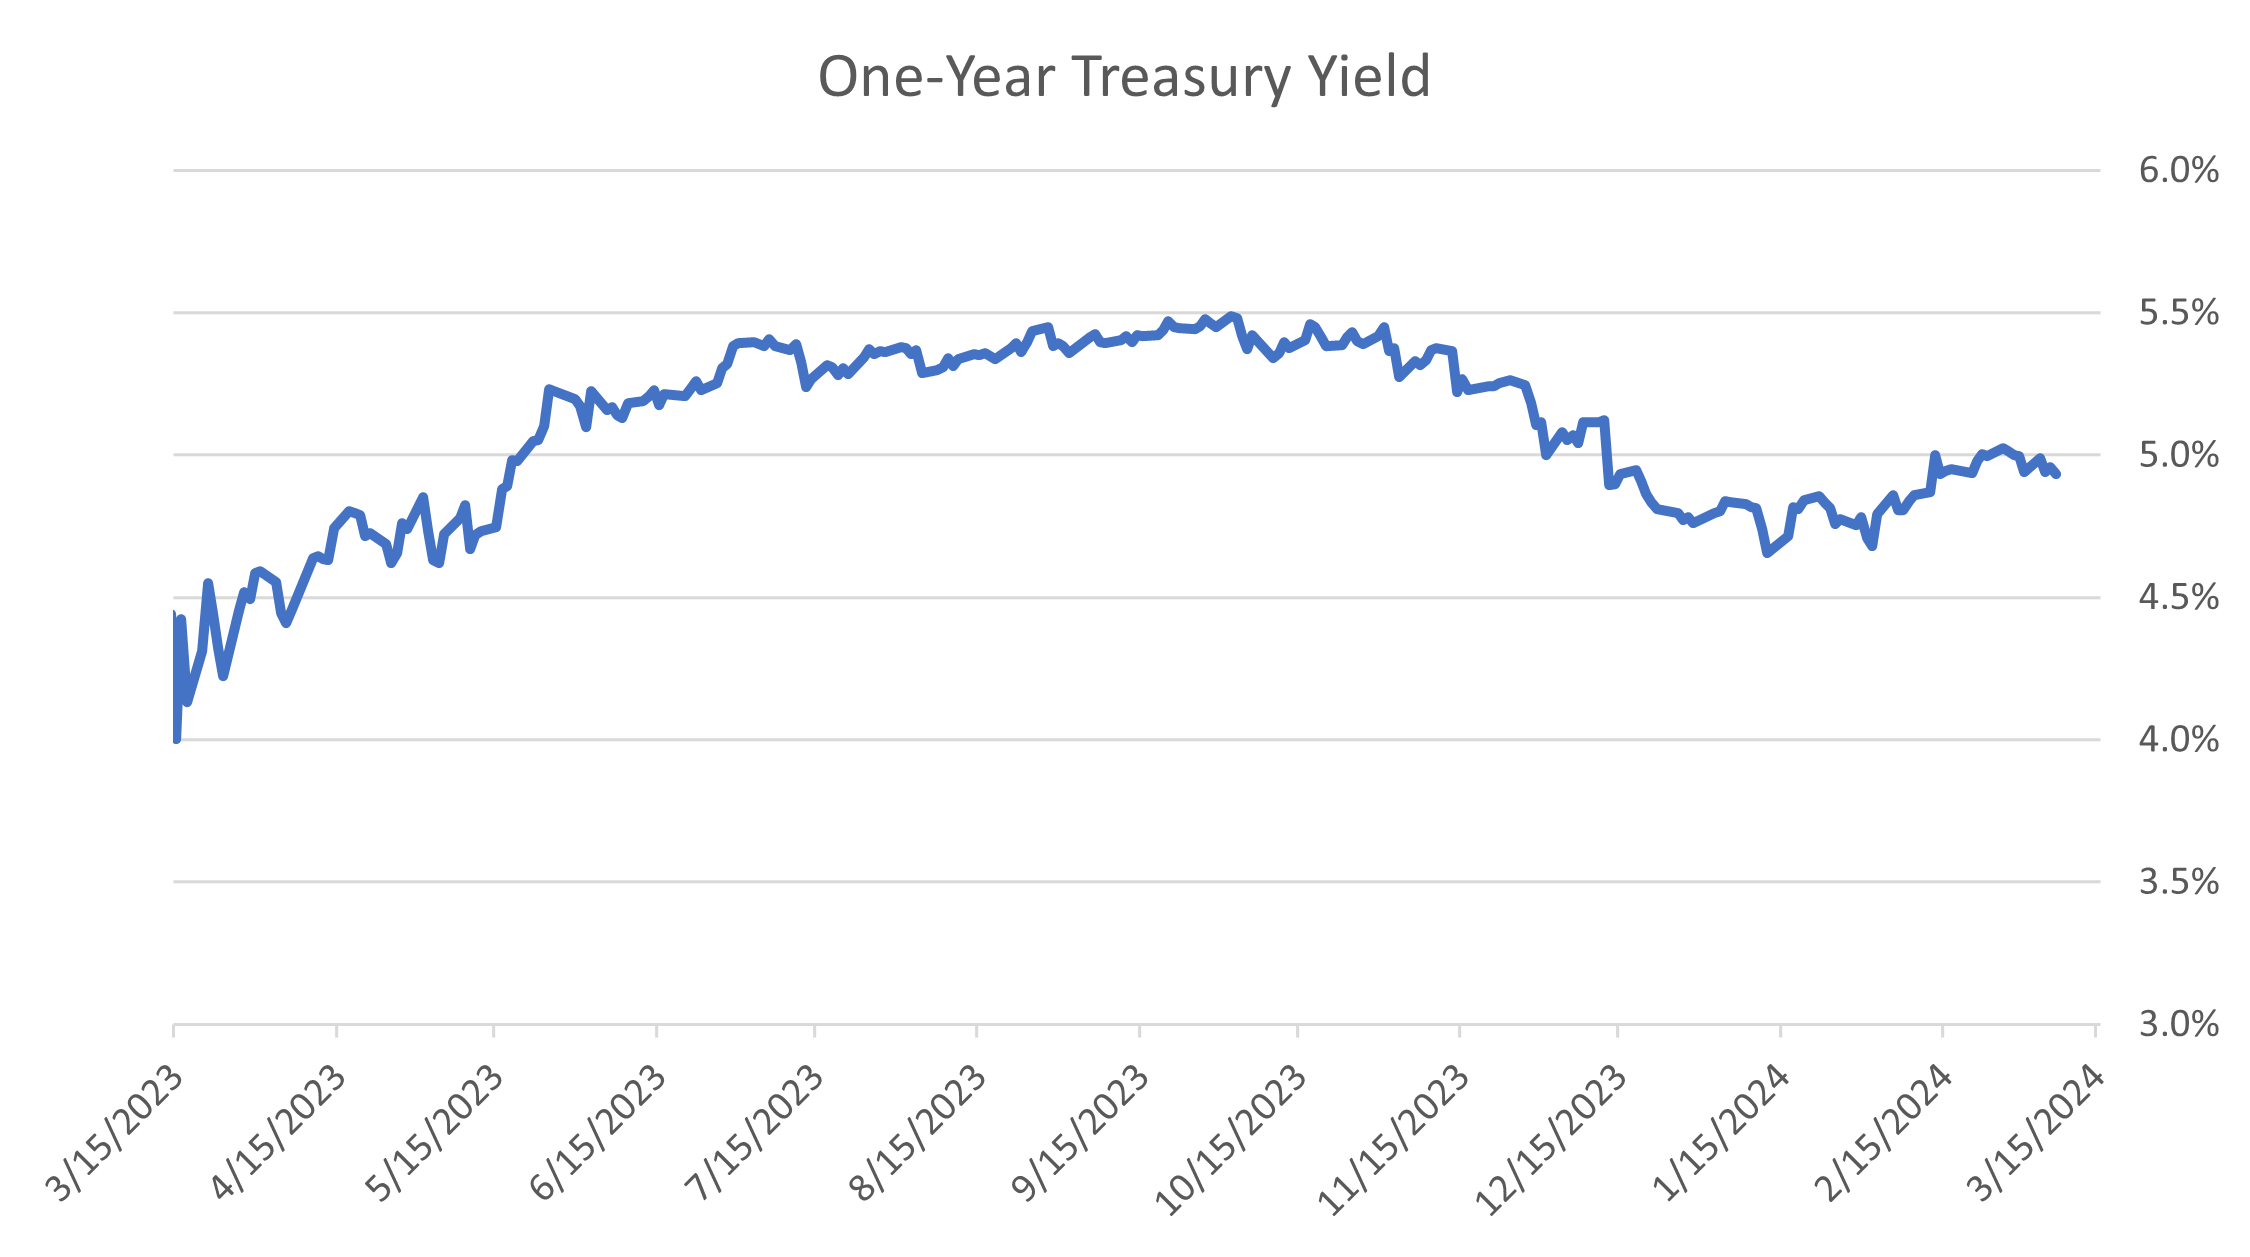
- Inflation has been elevated in recent reports.
- Despite elevated inflation, Fed officials have consistently looked past this and favored interest rate cuts later this year.
- Recent commentary from Fed Chair Powell was clearly dovish and reinforced cutting rates before 2% inflation is achieved.
- The one-year Treasury yield has fallen in recent months to reflect anticipated interest rate cuts.
- The market is expecting the first cut to happen at the June 2024 meeting.
2. Core Bond Asset Class Performance
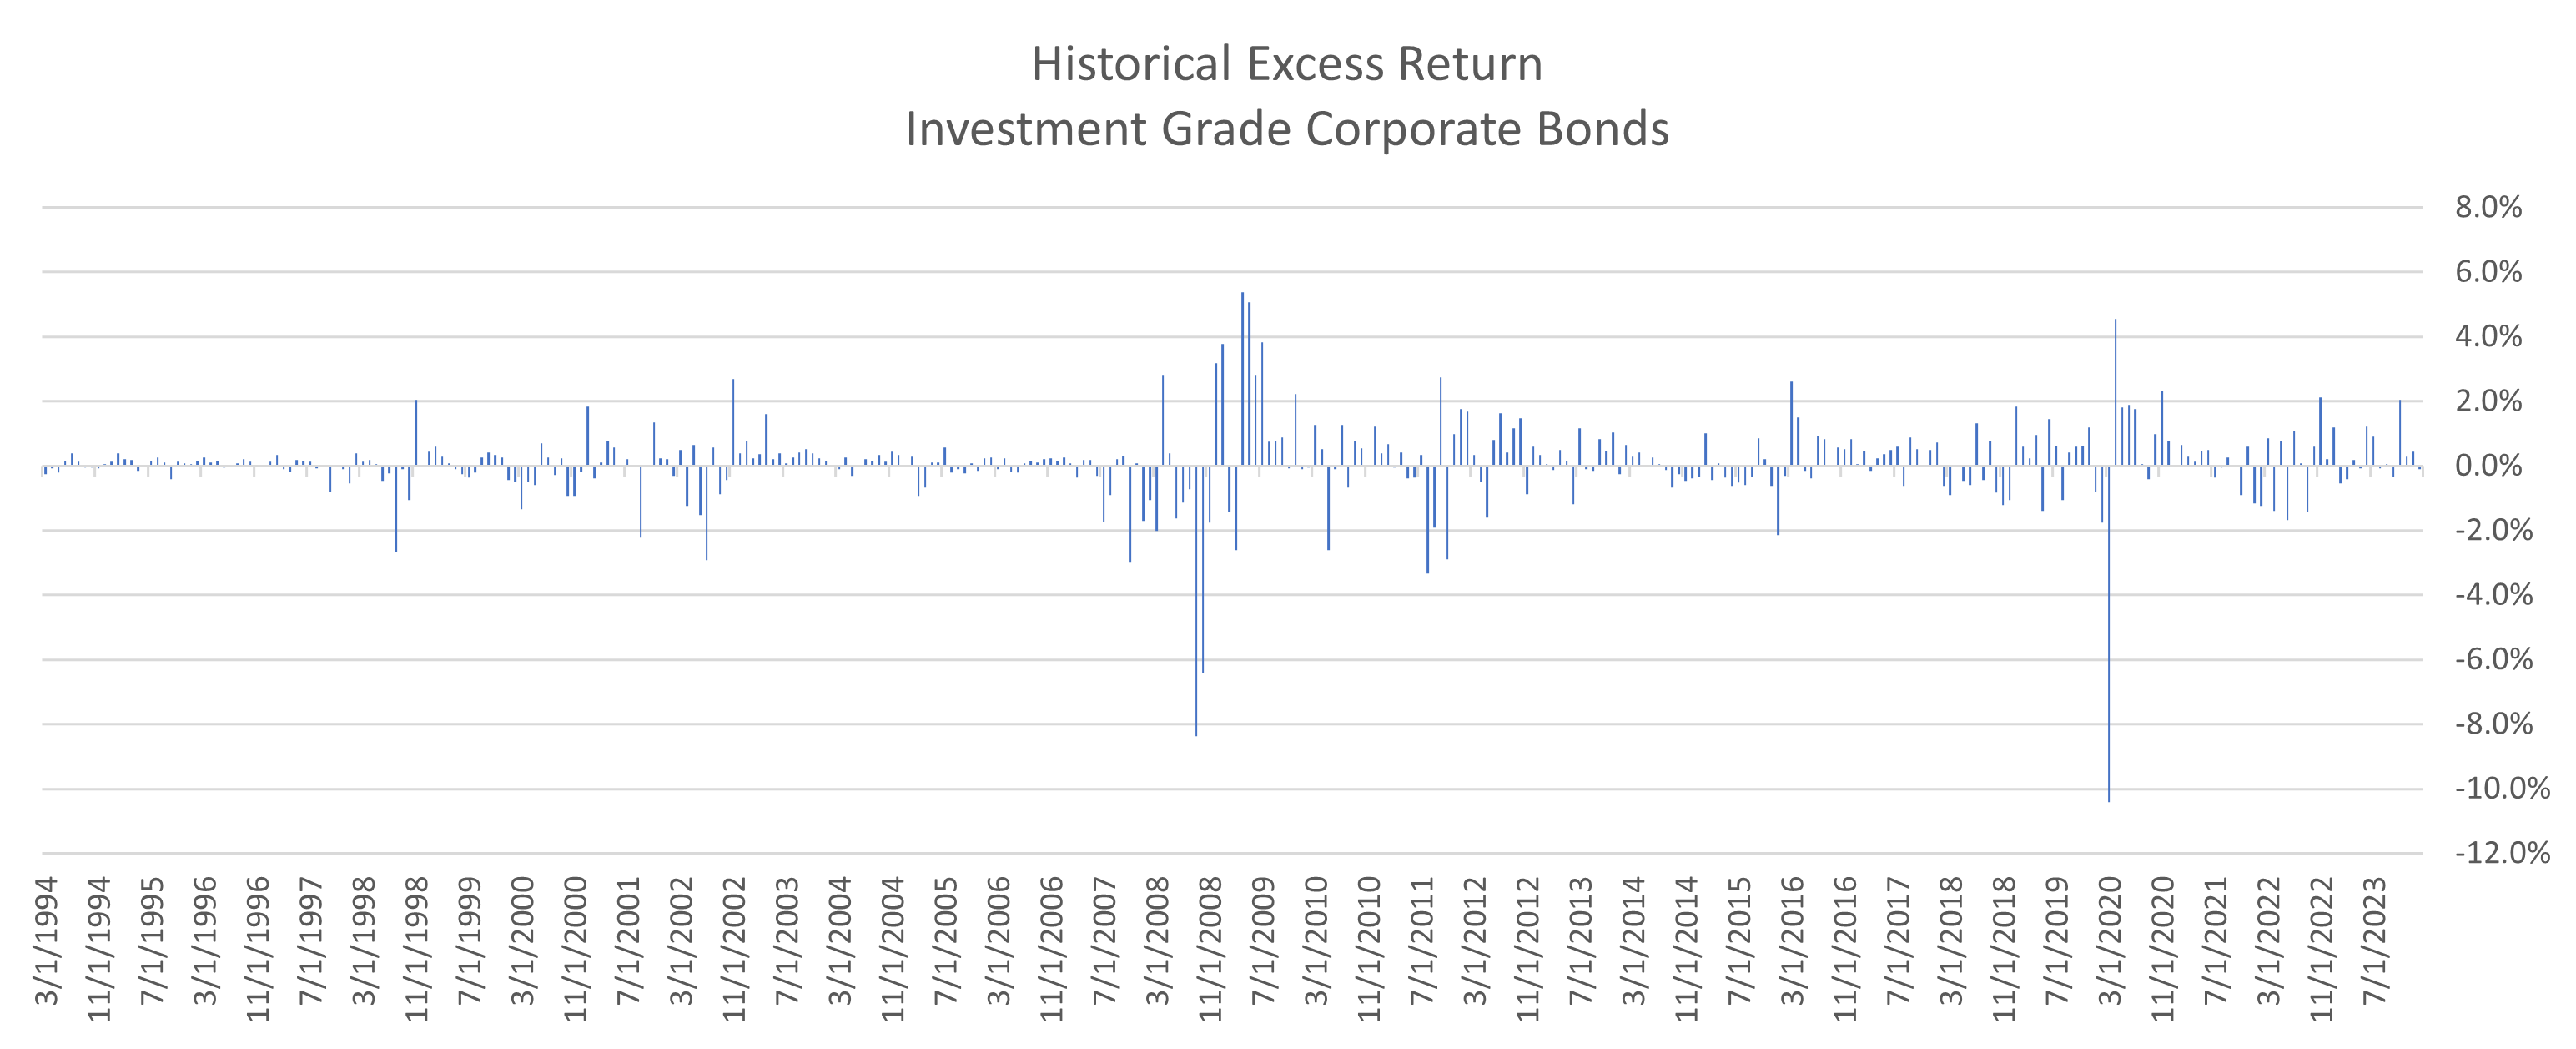
- Corporate bonds outperformed Treasuries in the long run.
- Corporate bond returns versus Treasuries is called excess return.
- They exhibit a negative skew, which means the biggest absolute return months are usually negative.
- Over the last 30 years, corporate bonds have outperformed Treasuries in 60% of the months.
- There have been four consecutive +2% months since the last -2% month.
3. Earnings Growth in Line with Long-term Average
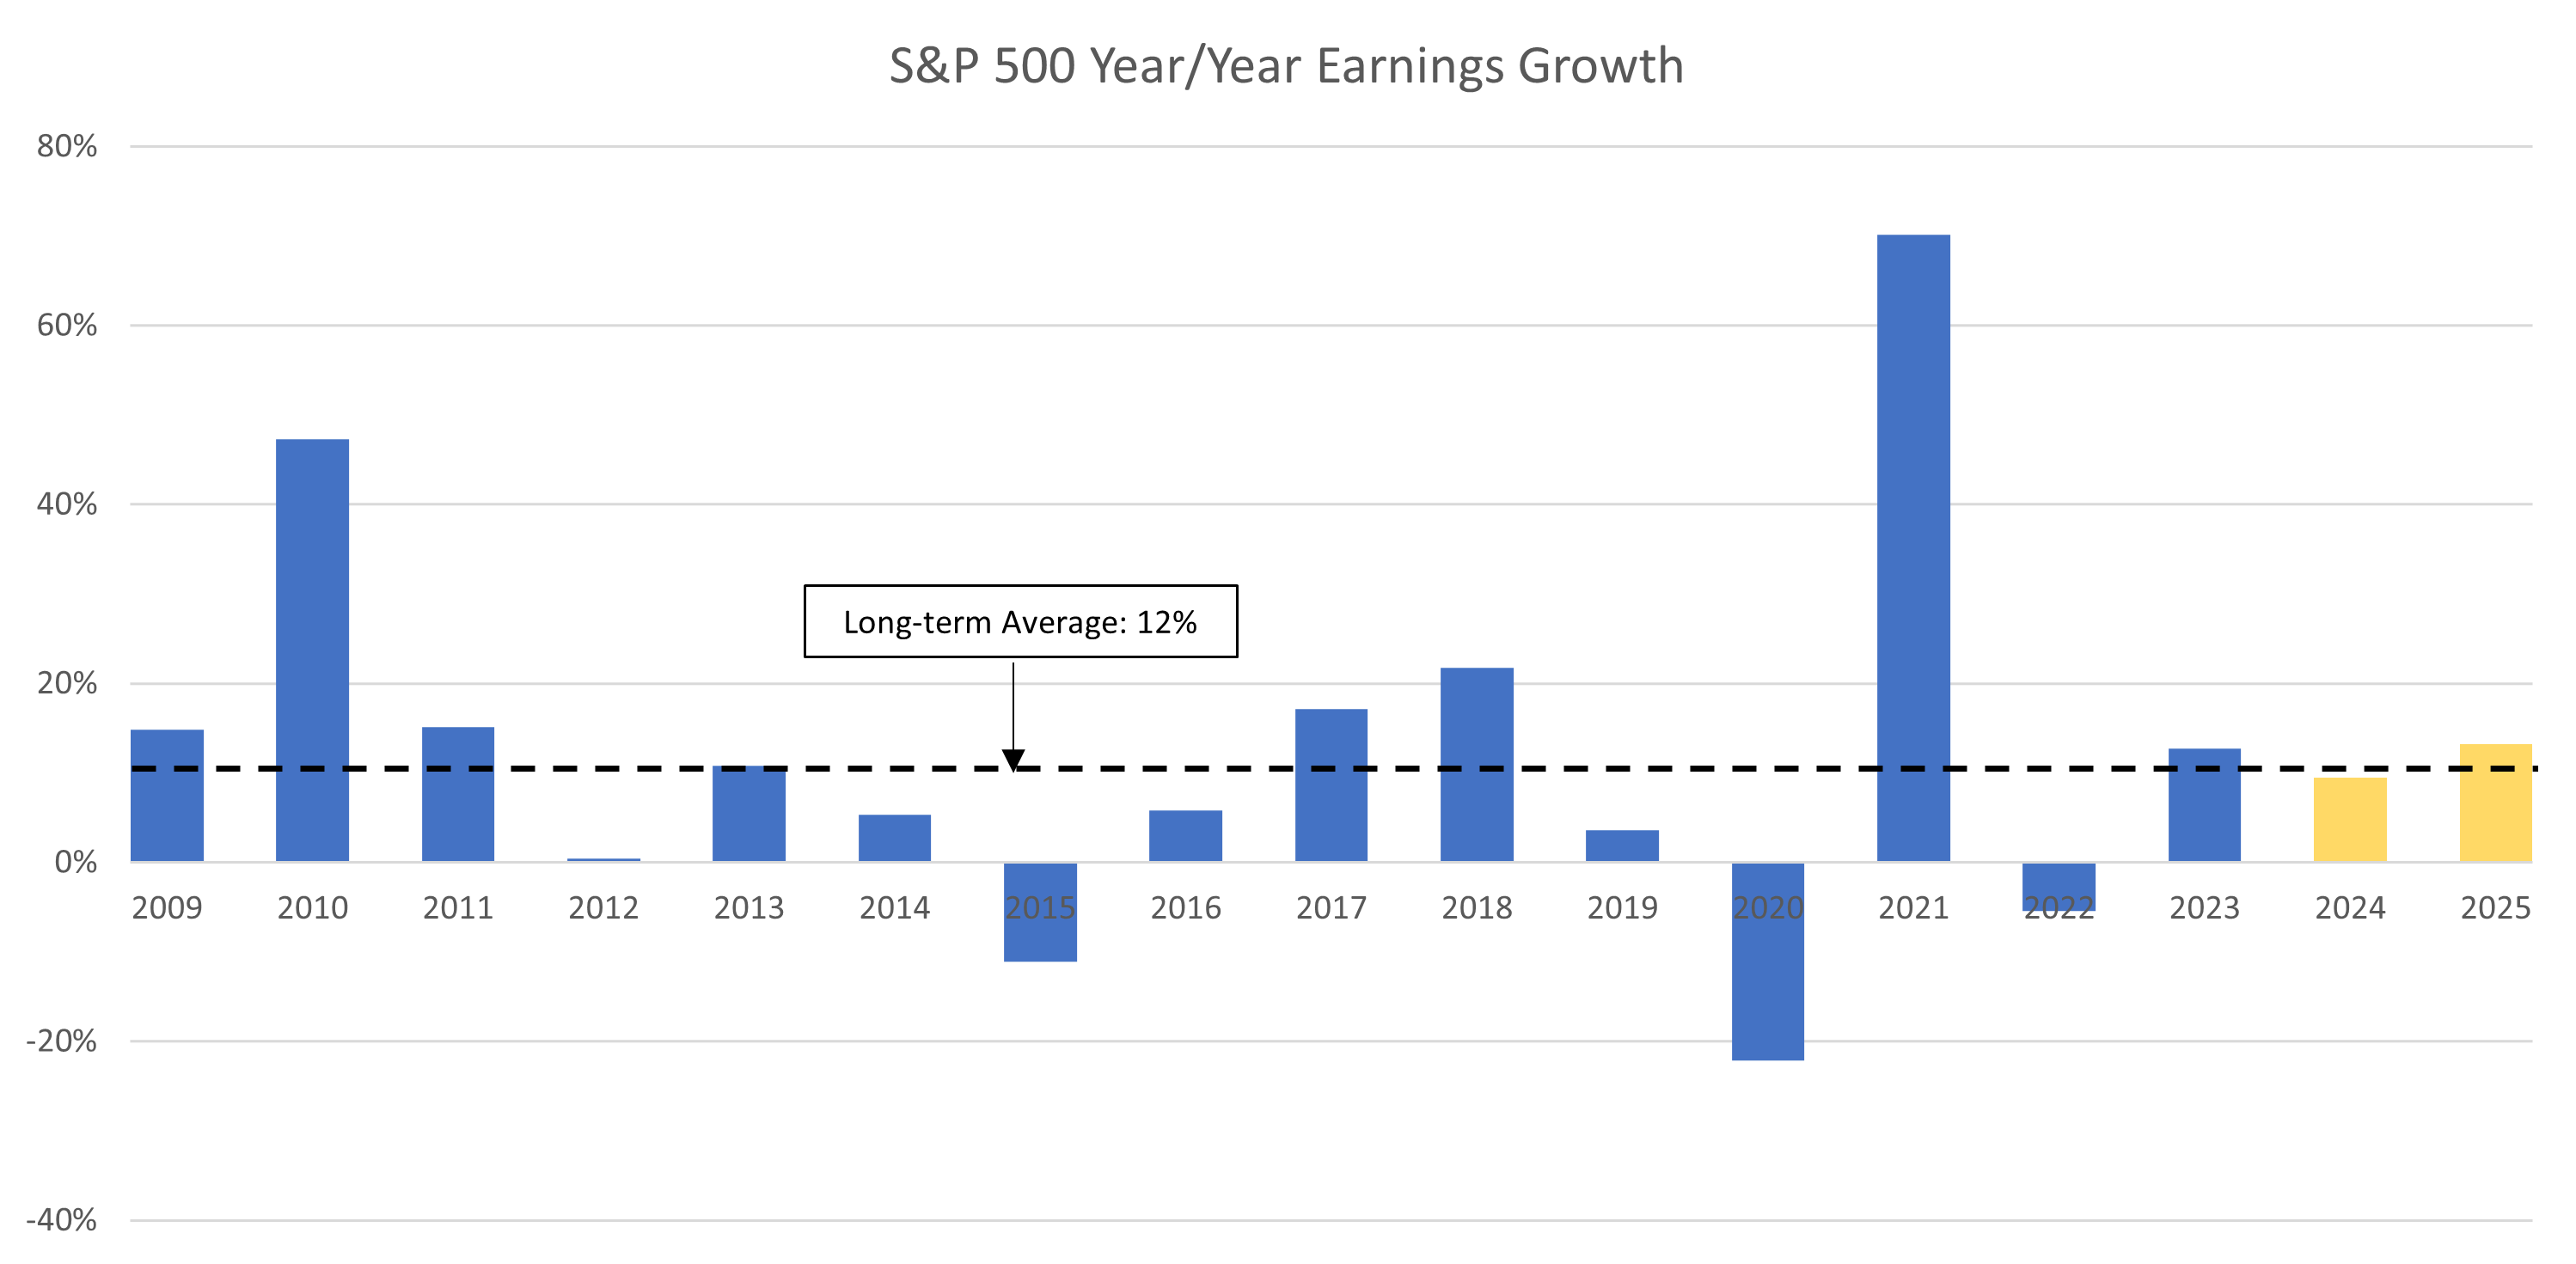
- Year-over-year earnings growth rates over the last several decades have seen wide dispersion due to capital market developments in addition to major global events (COVID, banking crisis, etc.).
- Earnings growth rates for 2023, 2024 and 2025 have stabilized and are more in line with the long-term average of around 12%.
- Despite the ongoing (but diminished) perceived threat of a recession and a significantly higher interest rate environment, companies continue to display the ability to increase earnings.
4. Magnificent 7 Skewing S&P 500 P/E
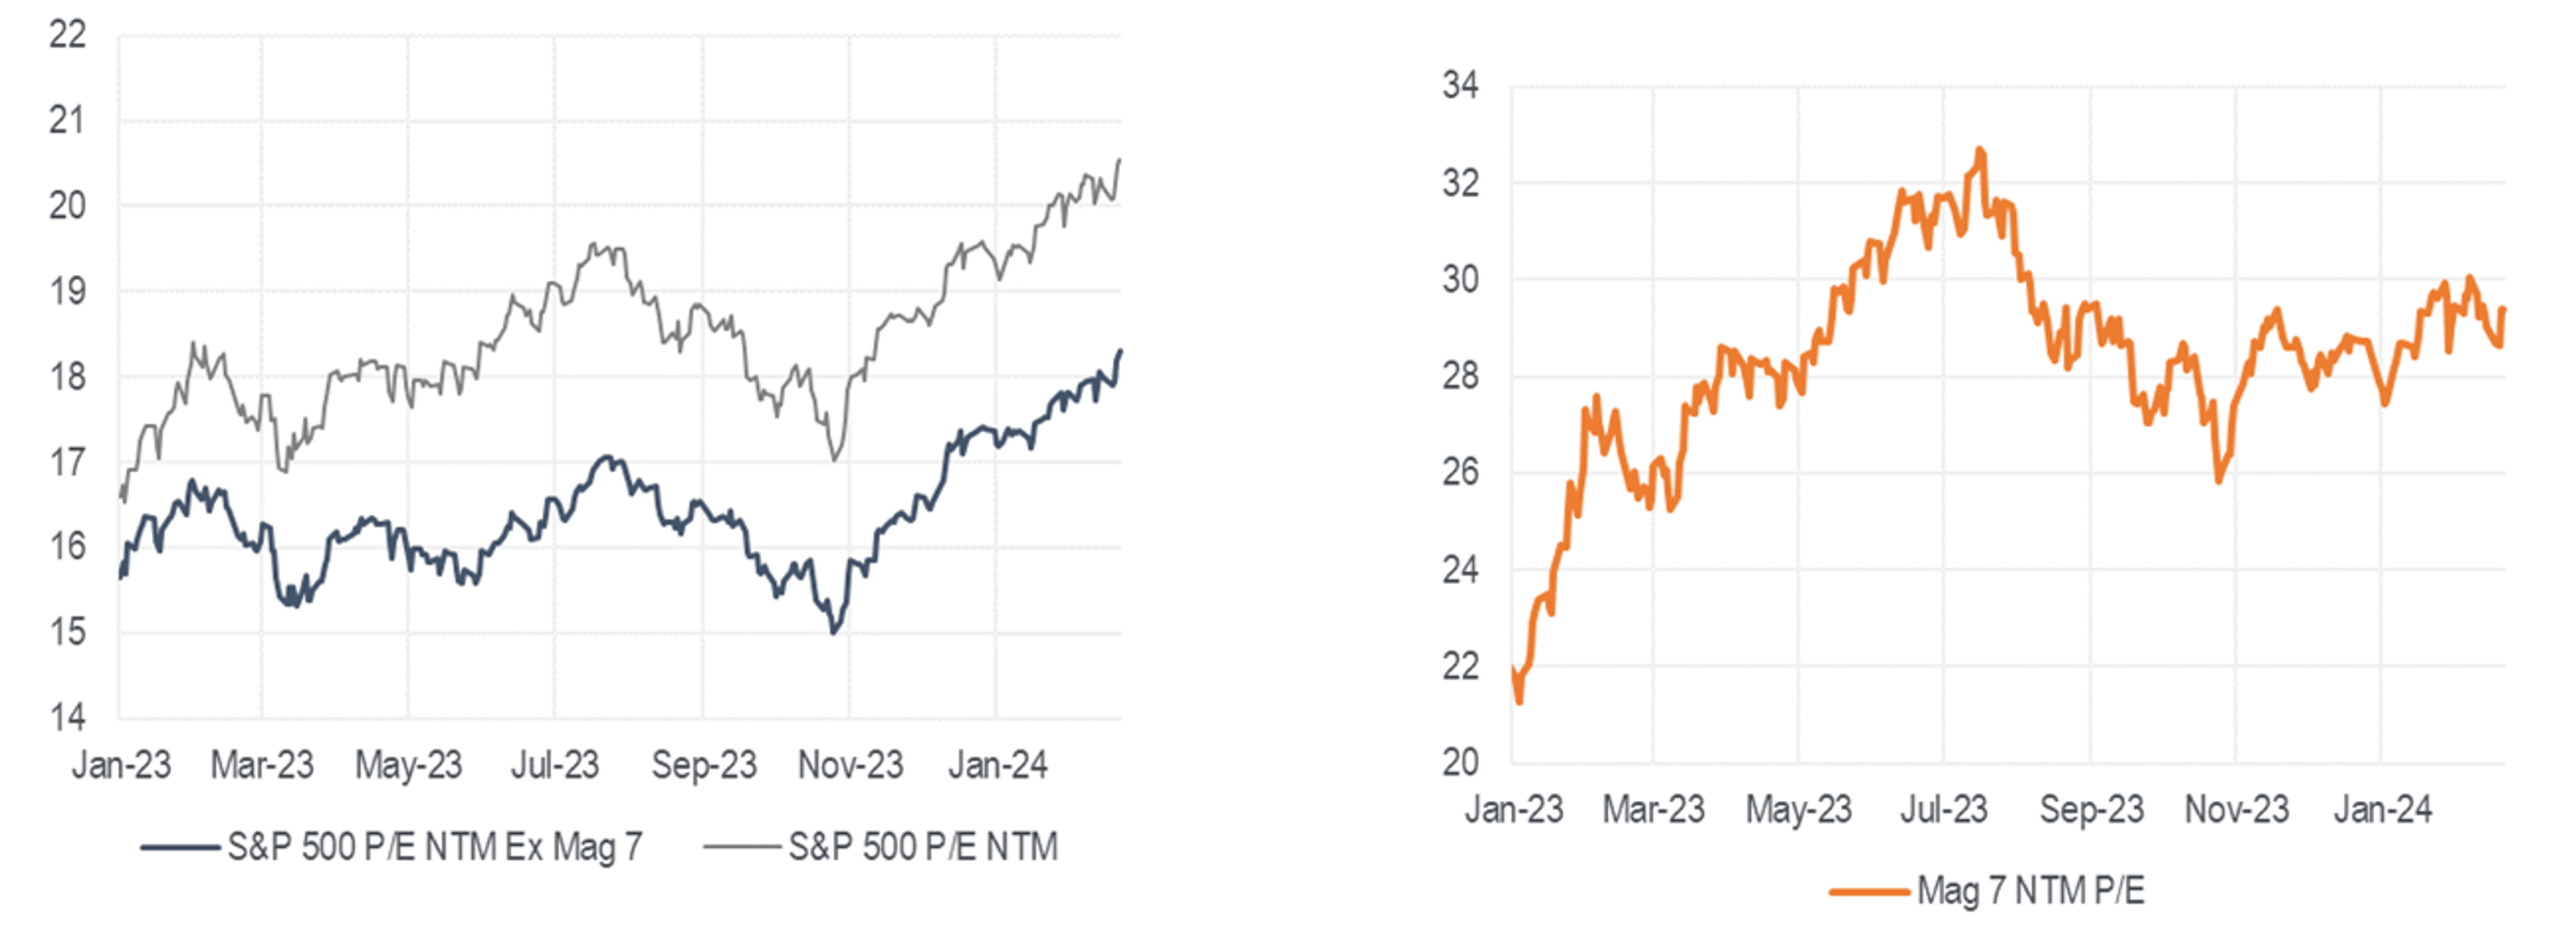
- The current Next Twelve Months (NTM) price-to-earnings (P/E) for the S&P 500 is approximately 20.5X. Removing the Magnificent 7 lowers the multiple several points to approximately 18X, which is below the long-term average for the overall market.
- The chart on the right displays the P/E of the Magnificent 7 isolated unto themselves. The NTM P/E of this group is almost 10 multiple points higher than the overall market’s P/E and has risen significantly from early 2023.
- Investors must be cognizant of this group of stocks when looking at overall market metrics such as P/E, earnings growth, etc. The differences between the Magnificent 7 and the rest of the market is significant.
5. Fiscal Policy Correlation with Stock Prices
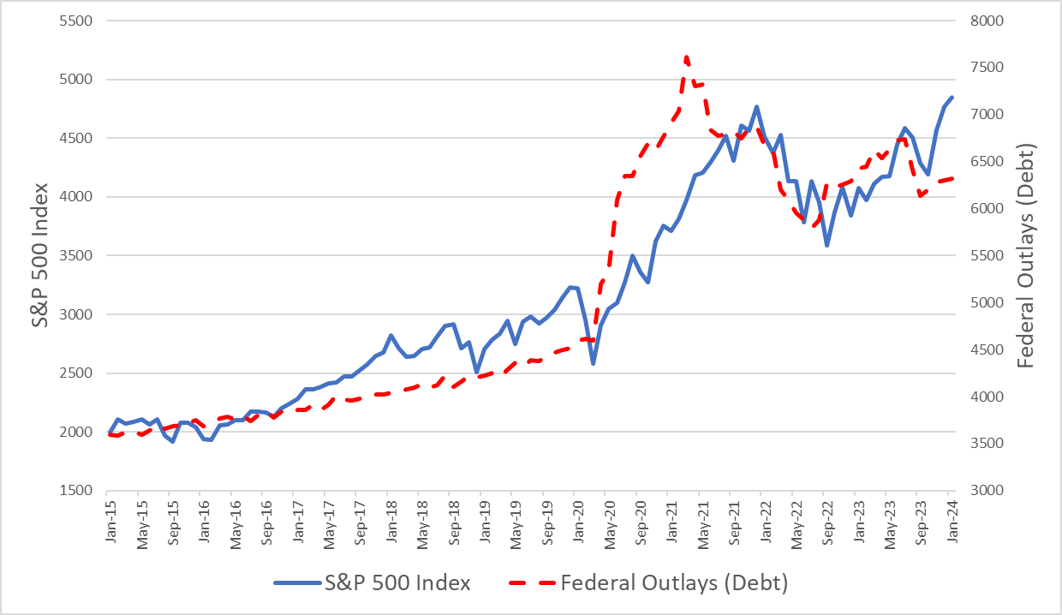
- While not as widely discussed as monetary policy (such as the Federal Reserve, interest rates, etc.), fiscal policy continues to be stimulative. The graph provided above illustrates the overlapping movements of Federal outlays and the performance of the Standard & Poor’s 500 Index over the past nine years.
- While not directly responsible for the increase in stock prices, the economic support provided by fiscal policy has been a positive contributor to economic growth.
- Ongoing fiscal stimulus may not be as robust going forward given the current deficit level relative to United States Gross Domestic Product (GDP).
Sources: BTC Capital Management, Bloomberg, PSC Portfolio Strategy, London Stock Exchange Group (LSEG), United States Treasury Department, Standard & Poor’s
The information provided has been obtained from sources deemed reliable, but BTC Capital Management and its affiliates cannot guarantee accuracy. Past performance is not a guarantee of future returns. Performance over periods exceeding 12 months has been annualized.
This document is intended for informational purposes only and is not an offer or solicitation with respect to the purchase or sale of any security. Statements in this report are based on the views of BTC Capital Management and on information available at the time this report was prepared. Rates are subject to change based on market and/or other conditions without notice. This commentary contains no investment recommendations and you should not interpret the statement in this report as investment, tax, legal, and/or financial planning advice. All investments involve risk, including the possible loss of principal. Investments are not FDIC insured and may lose value.