
Welcome to Five in Five, a monthly publication from the Investment Team at BTC Capital Management. Each month we share graphs around five topics that illustrate the current state of the markets, with brief commentary that can be absorbed in five minutes or less. We hope you find this high-level commentary to be beneficial and complementary to Weekly Insight and Investment Insight.
This month’s Five in Five covers the following topics:
- Employment Divergences
- Inverted Curves Support Fixed Income
- China Equity Rebound in November
- Declining Affordability Leads to Declining Home Prices
- Supply Chain Cost and Bottlenecks Easing
1. Employment Divergences
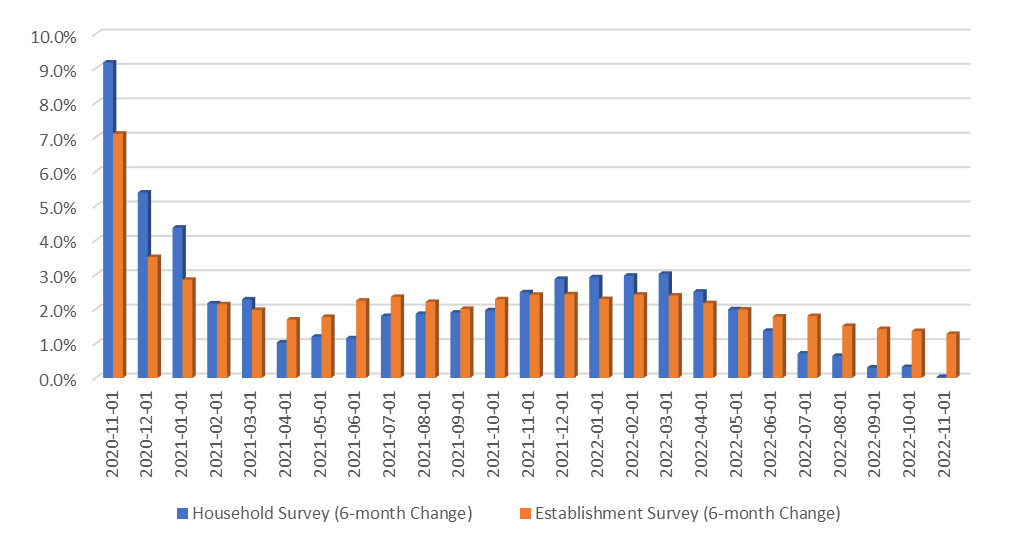
- The more popular Establishment Survey continues to show job growth above 1%.
- The Household Survey job creation is unchanged over the last six months.
- The cumulative six months difference between the two surveys is about 1.9 million jobs.
- The Household Survey has less smoothing and better identifies turning points.
- But, the Establishment Survey will exhibit similar results during soft landings as well.
2. Inverted Curves Support Fixed Income
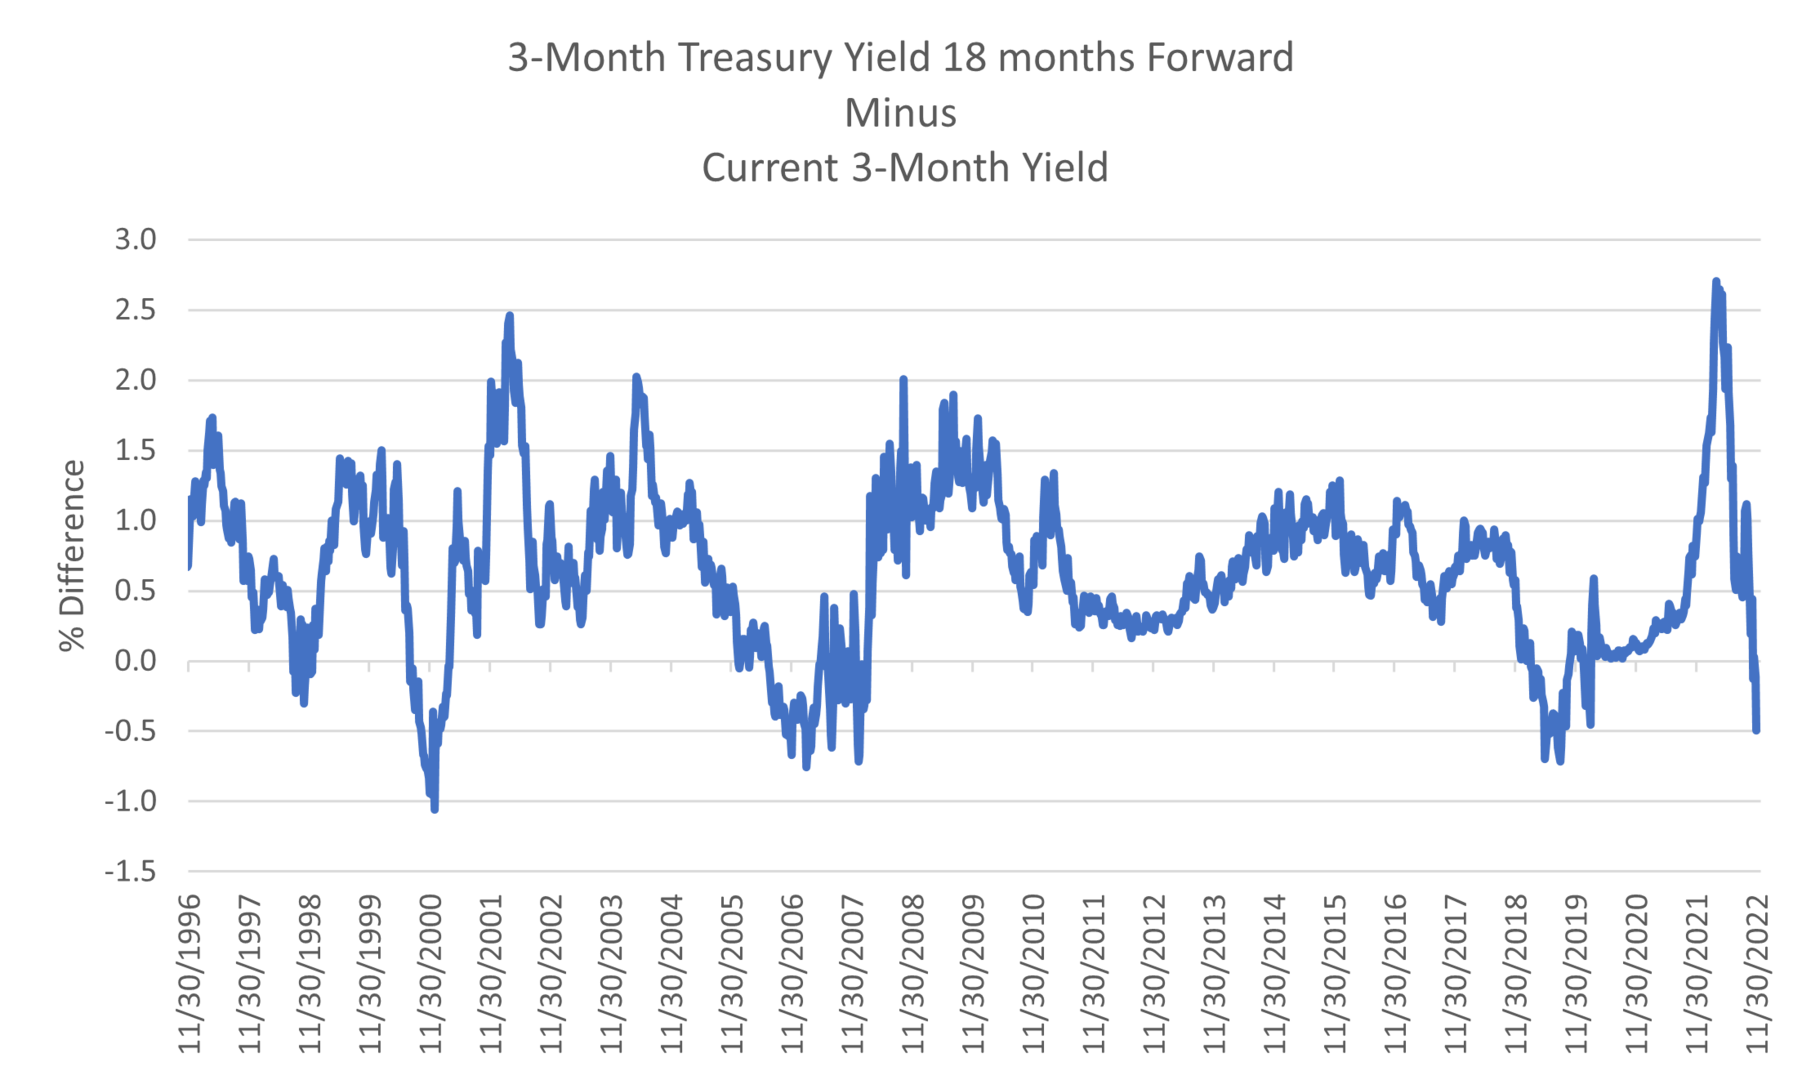
- The market is pricing the 3-month Treasury yield to be 3.8% in mid-2024.
- The current 3-month Treasury yield is 4.2%, resulting in a 40-basis points inversion.
- This level has preceded the last three recessions.
- The average 1-year forward return for core bonds after the curve first inverts is 7.4% (4 occurrences).
- The average 2-year forward annualized return after the curve first inverts is 6.4% (4 occurrences).
3. China Equity Rebound in November
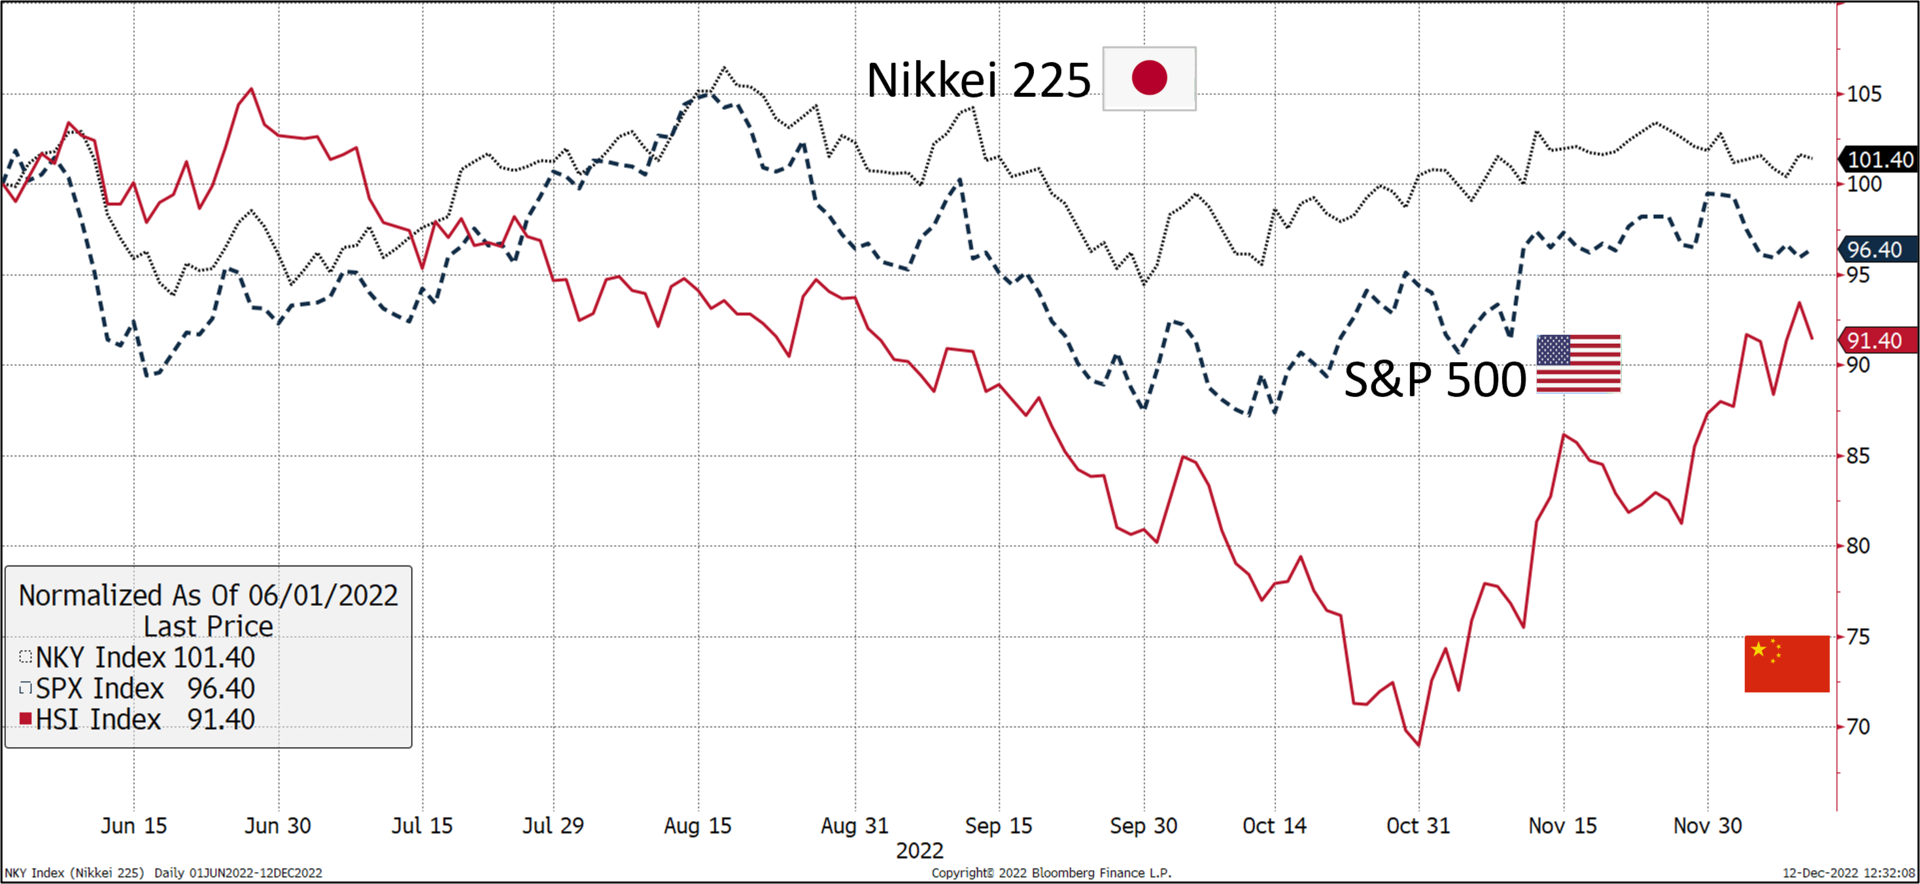
- China’s zero COVID policies, which resulted in government lockdowns and regulations, have cut real GDP estimates to 3.2%, about half of the previous five-year levels.
- A 3Q real GDP rebound of +3.9% has stabilized export levels after declines of export rates during 1H 2022 led to increased volatility and underperformance of the Hang Seng Index.
- With the most recent round of loosening of restrictions, the Hang Seng has rebounded since the end of October, but still remains below both Japanese and U.S. markets over the last six months.
- This recovery by the Hang Seng’s return has helped it outpace other emerging markets since mid-year.
- Rising COVID cases in China may slow the pace of economic recovery if lockdowns are reinstated.
4. Declining Affordability Leads to Declining Home Prices
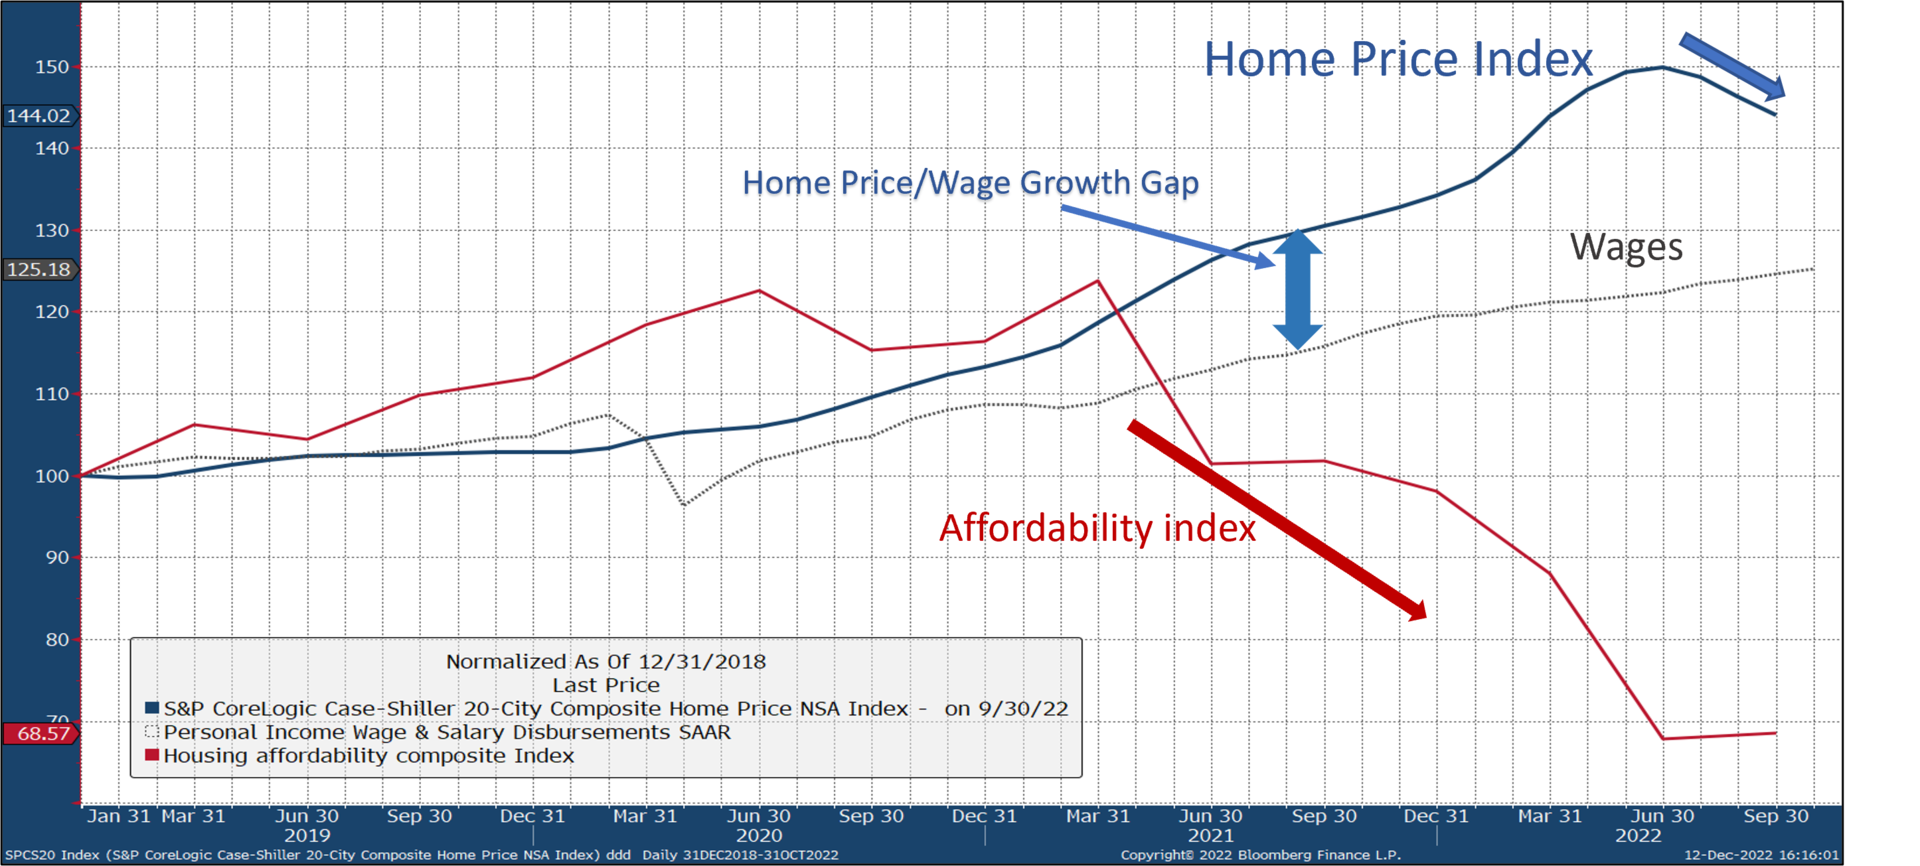
- After multi-year increases housing prices have begun to roll over and price declines are anticipated to continue into 2023.
- Despite the recent move lower in home prices, recent growth has significantly outpaced wage growth.
- Housing markets that experienced the strongest growth and have a high level of supply coming on-stream are anticipated to experience more significant price declines.
- Affordability Index is stabilizing due to recent declines in home prices and mortgage rates that have now declined for four consecutive weeks.
5. Supply Chain Cost and Bottlenecks Easing
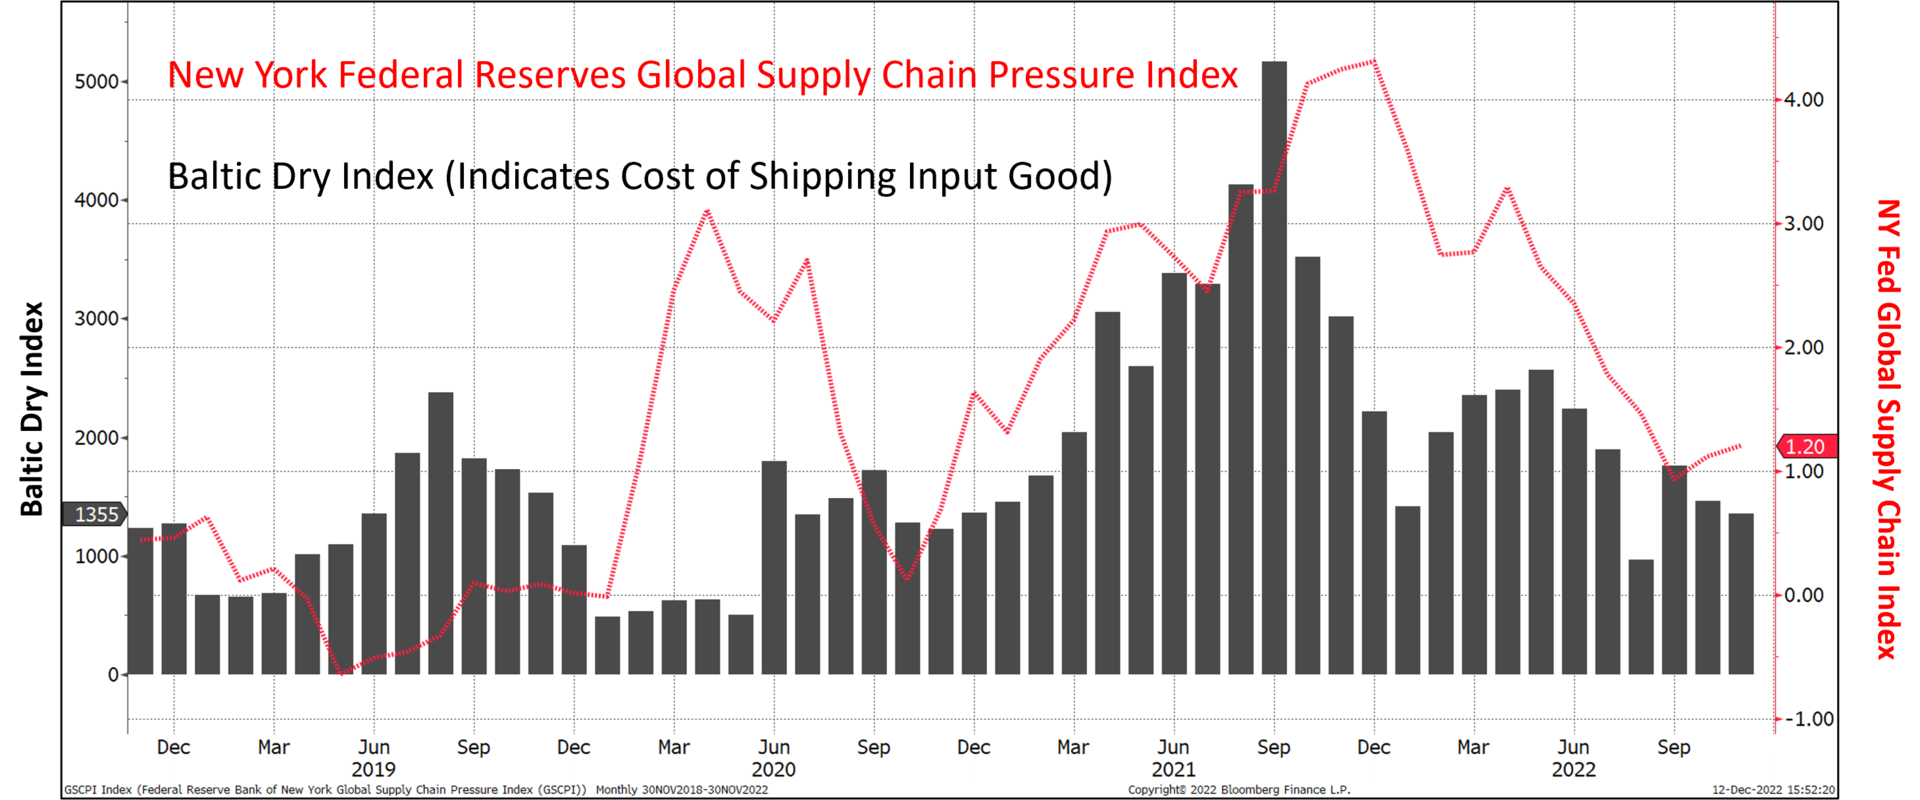
- The Baltic Dry Index (BDI) is an index of average prices paid for the transport of dry bulk materials, such as coal and steel, across more than 20 routes.
- The BDI is often used as a leading economic indicator because changes in the index reflect supply and demand levels for basic inputs used in the manufacturing process. The lower levels currently exhibited suggest potential for slower economic growth.
- The index can experience high levels of volatility because the supply of large carriers tends to be small with long lead times and high production costs.
- Despite a recent uptick supply chain pressure has eased considerably in 2022. Recent increase is attributed to slower delivery times in China.
- Evidencing the reduction of supply chain pressure in the U.S. is the recent reading of the Logistics Managers’ Index which in November hit its lowest level since April 2020.
Source: BTC Capital Management, U.S. Bureau of Labor Statistics, Bloomberg Finance L.P., Bureau of Economic Analysis, S&P Corelogic, National Association of Realtors
The information provided has been obtained from sources deemed reliable, but BTC Capital Management and its affiliates cannot guarantee accuracy. Past performance is not a guarantee of future returns. Performance over periods exceeding 12 months has been annualized.
This document is intended for informational purposes only and is not an offer or solicitation with respect to the purchase or sale of any security. Statements in this report are based on the views of BTC Capital Management and on information available at the time this report was prepared. Rates are subject to change based on market and/or other conditions without notice. This commentary contains no investment recommendations and you should not interpret the statement in this report as investment, tax, legal, and/or financial planning advice. All investments involve risk, including the possible loss of principal. Investments are not FDIC insured and may lose value.