
Welcome to Five in Five, a monthly publication from the Investment Team at BTC Capital Management. Each month we share graphs around five topics that illustrate the current state of the markets, with brief commentary that can be absorbed in five minutes or less. We hope you find this high-level commentary to be beneficial and complementary to Weekly Insight and Investment Insight.
This month’s Five in Five covers the following topics:
- Corporate Bonds
- JOLTS Job Openings
- Percent Return in S&P
- S&P 500 Earnings Yield vs. 10-Year Treasury Yield
- Relative Valuation
1. Corporate Bonds
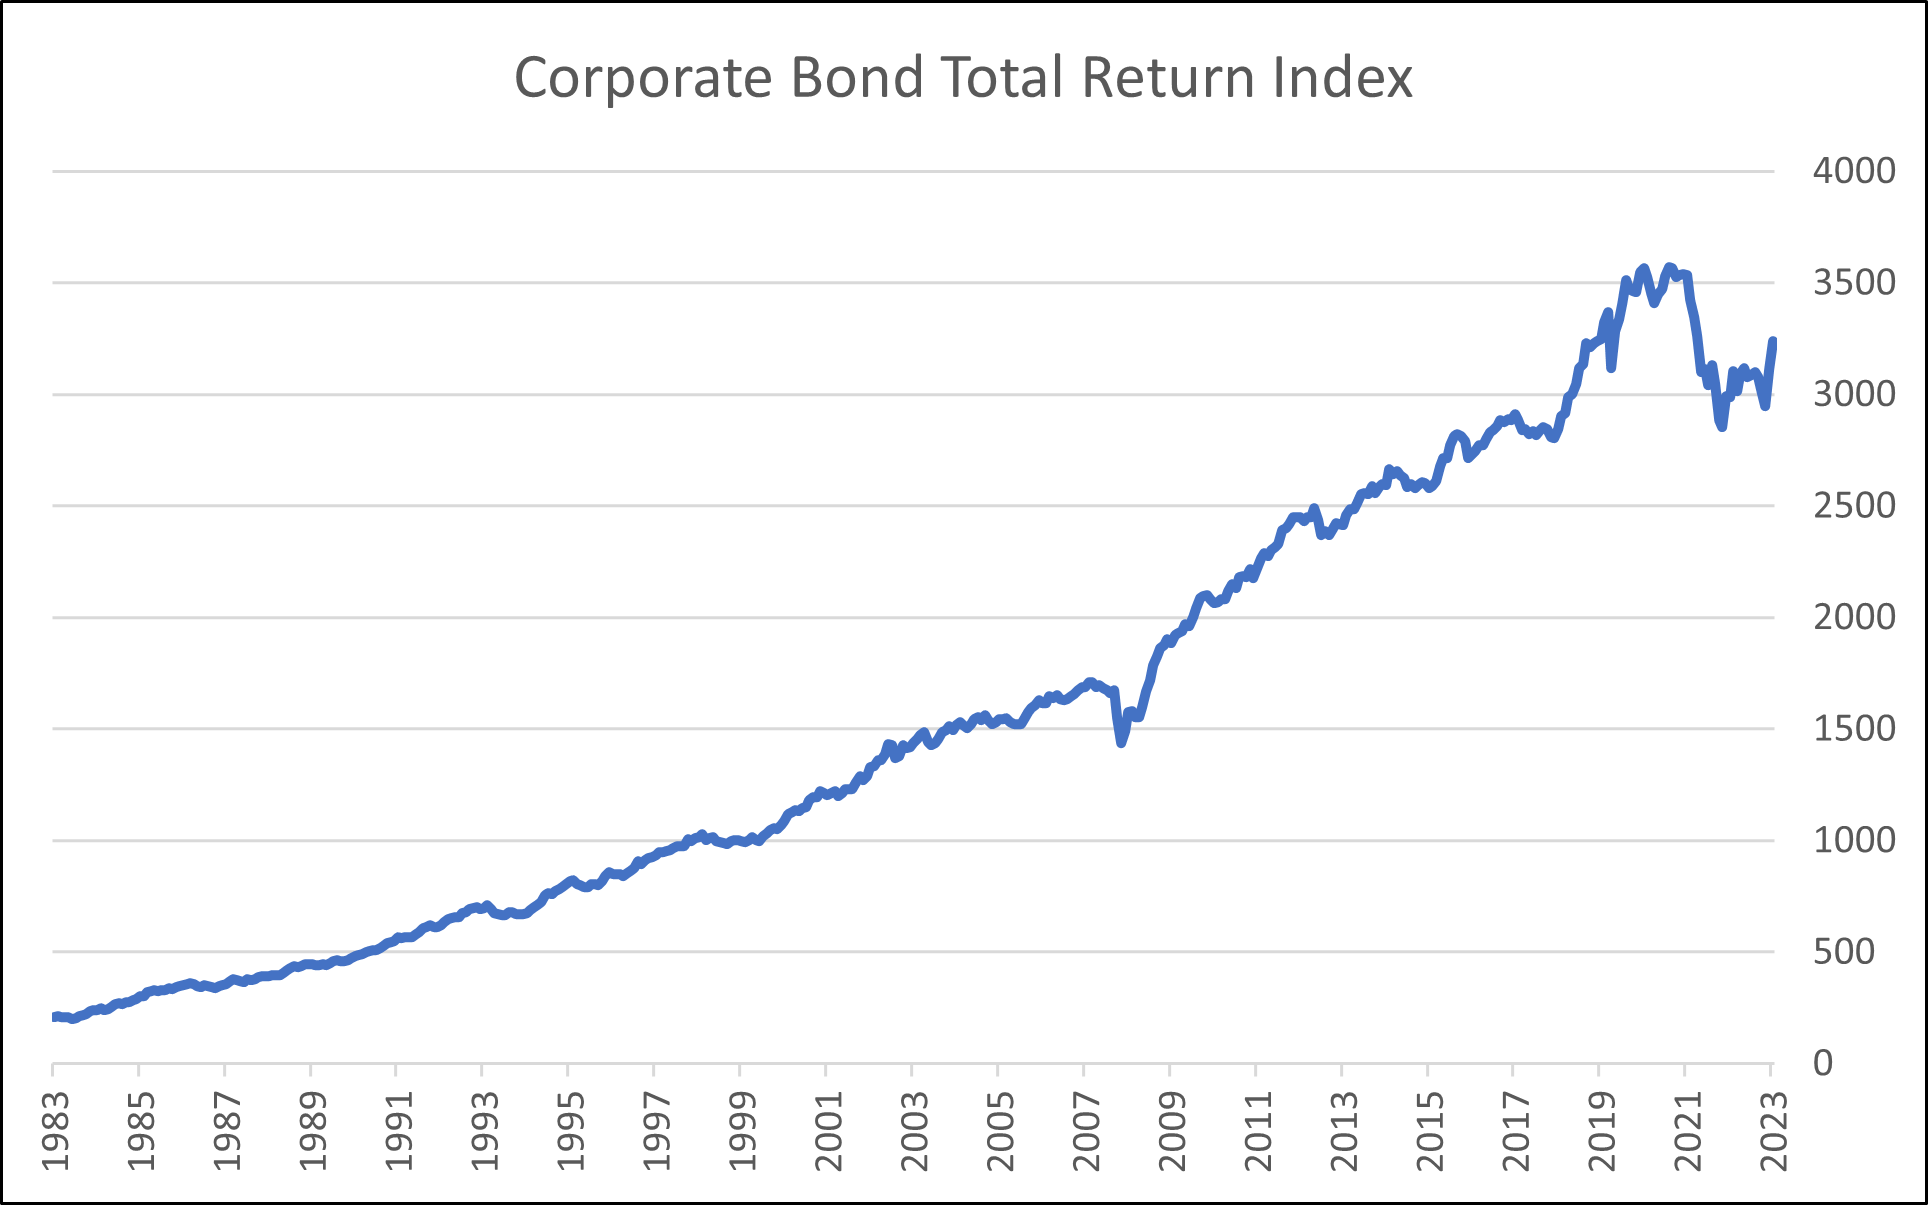
- Investment grade corporate bonds generated a 7.1% annualized gain over 40 years.
- Compounding coupon payments creates a self-healing mechanism during drawdowns.
- The current yield-to-worst for the corporate bond index is 5.3%.
- The current duration is 6.7 and results in a yield-to-duration ratio of 0.79.
- The yield-to-duration ratio in December 2020 was 0.22.
2. JOLTS Job Openings
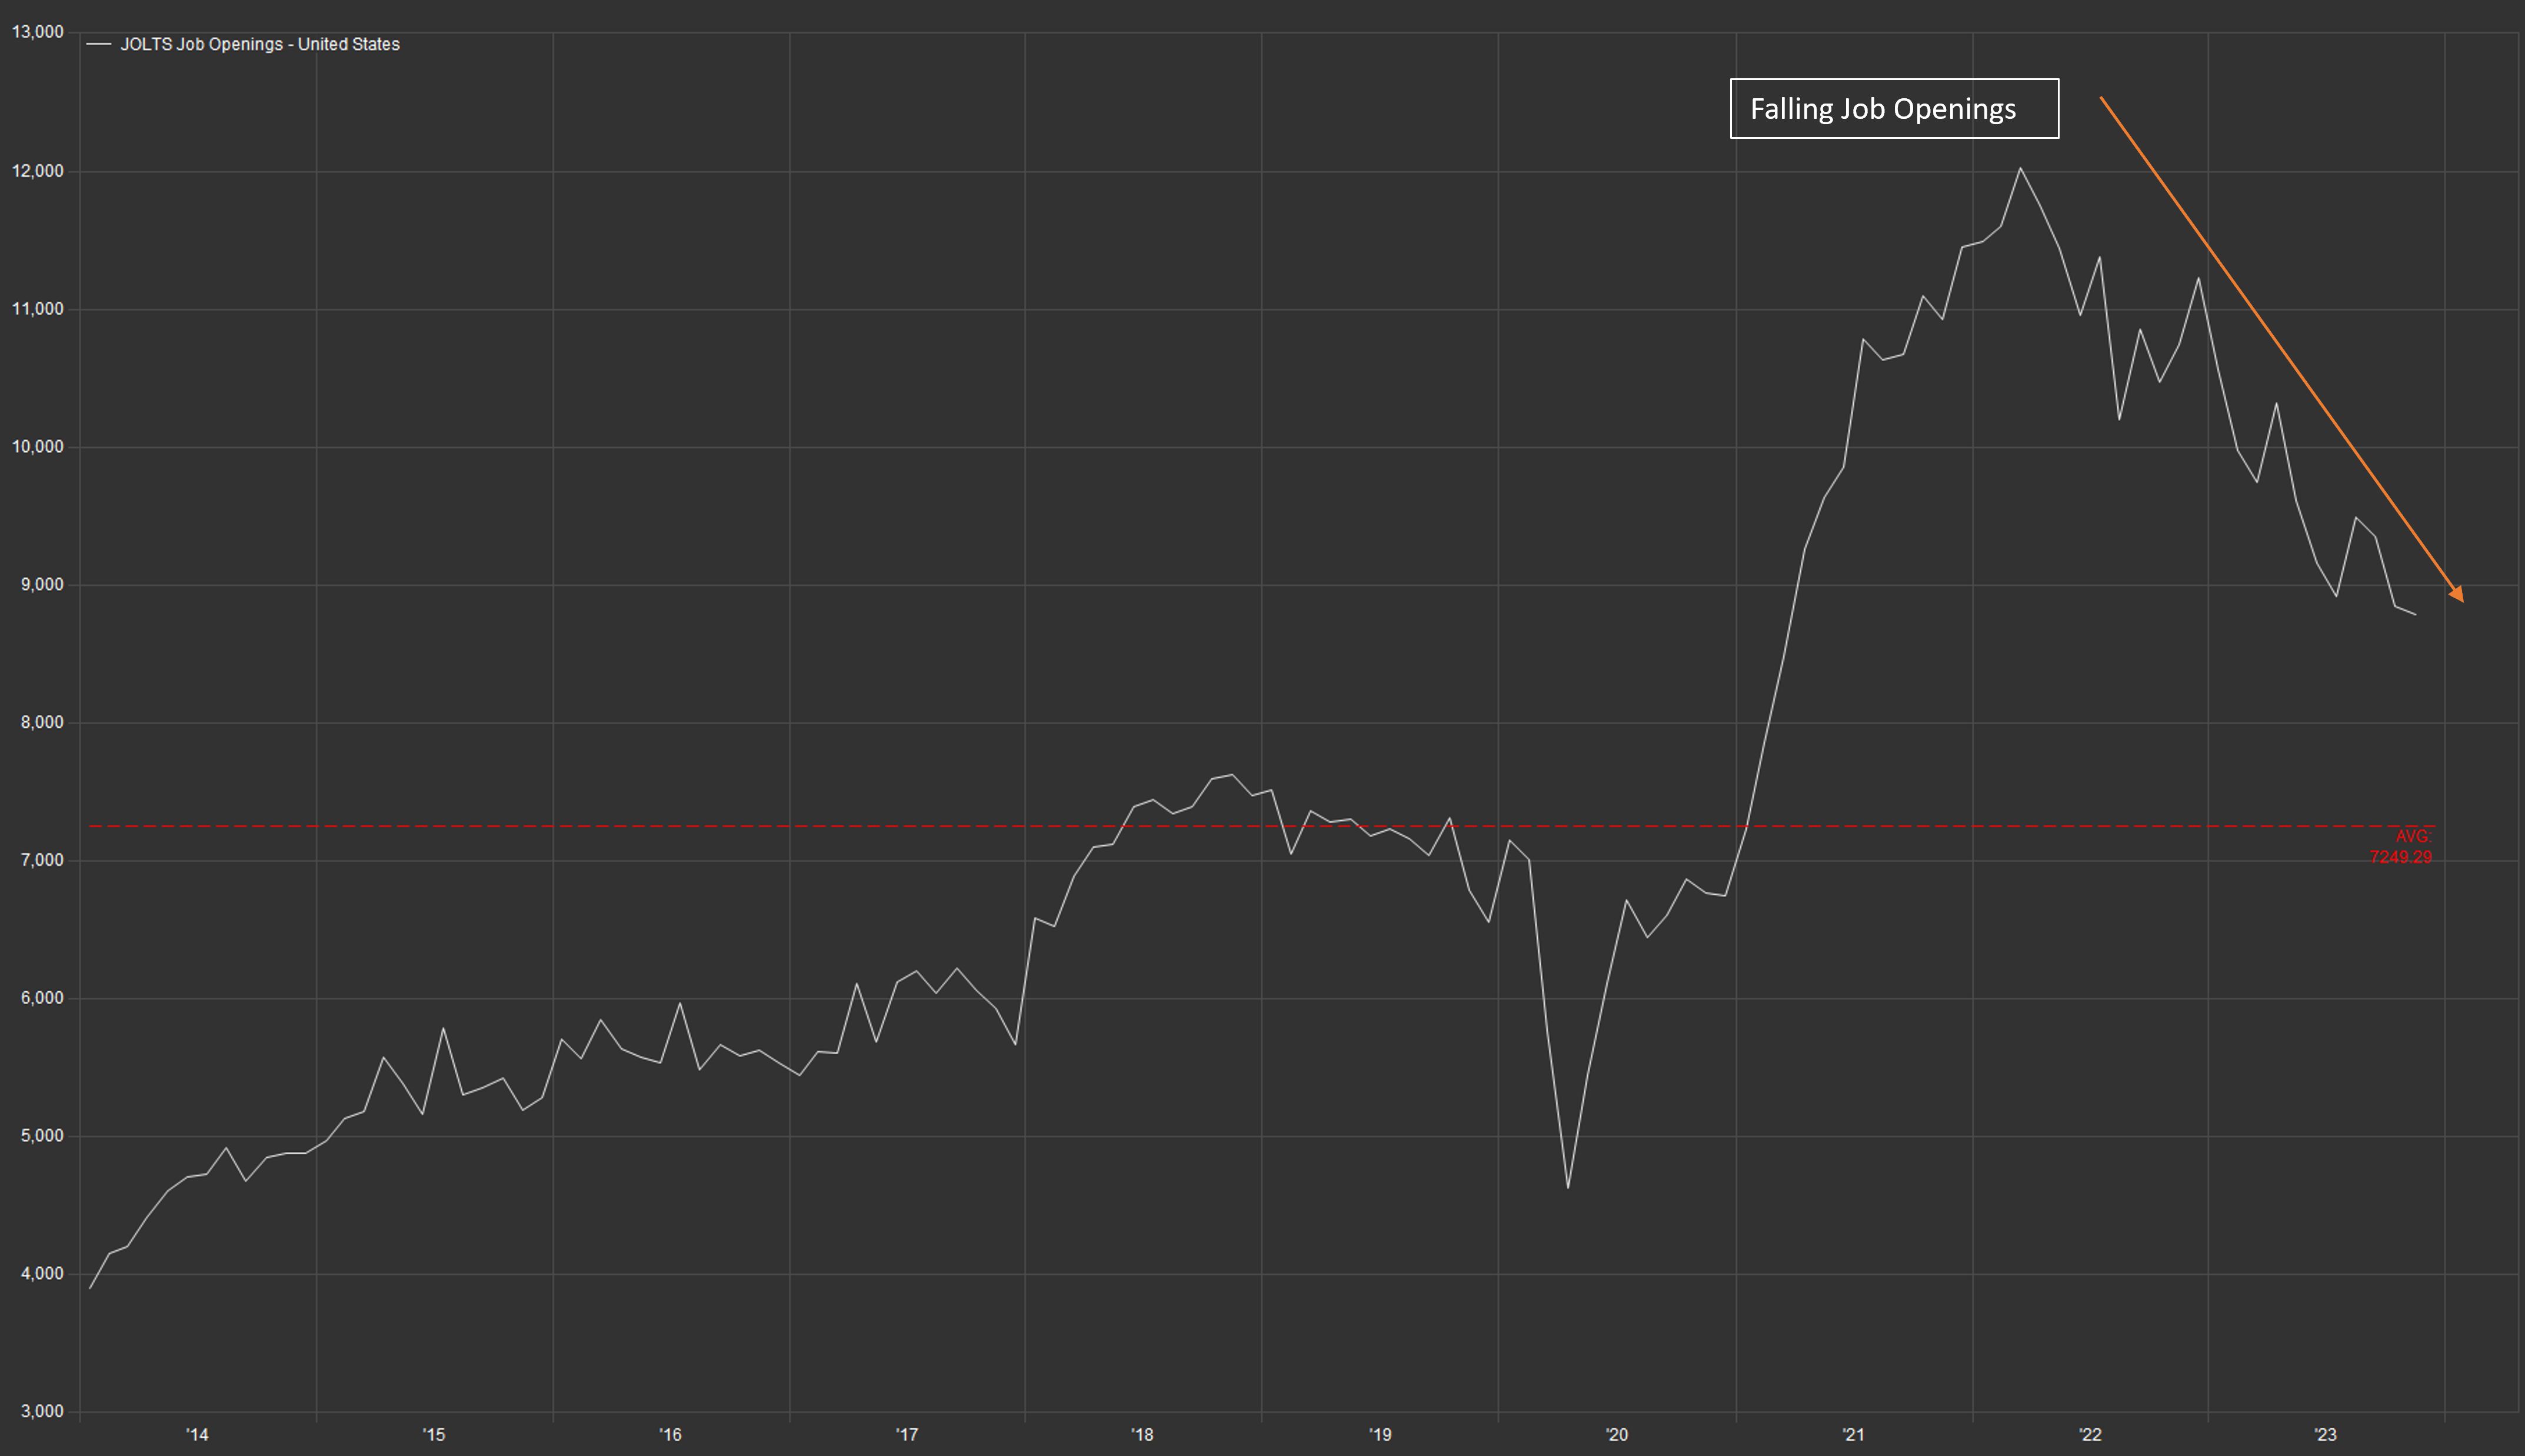
- The most recent release of job vacancies (JOLTS job openings) for November marked the lowest amount of vacancies since April 2020.
- Although the number of job vacancies has been falling, the latest reading remains well above the 10-year average (approximately 7.2 million).
- Despite forecasts for a potential recession, the labor market has remained persistently strong with unemployment rates at or near decade lows.
- Investors will continue to monitor the strength of the labor market in determining the ongoing strength of the overall economy.
3. Percent Return in S&P

- Equity markets finished the fourth quarter on a high note, capping a very strong 2023 for stocks in general.
- During 2023, large cap growth stocks were the best performing group, dominated by the Magnificent 7.
- However, during the fourth quarter of 2023, small cap stocks were the best performing group. Additionally, value stocks across large, mid, and small cap stocks were the best performing group, outpacing core and growth stocks.
- As investors turn to a “risk-on” mentality, the markets may see a rotation into less risky, value-based stocks as an alternative to riskier growth stocks.
4. S&P 500 Earnings Yield vs. 10-Year Treasury Yield
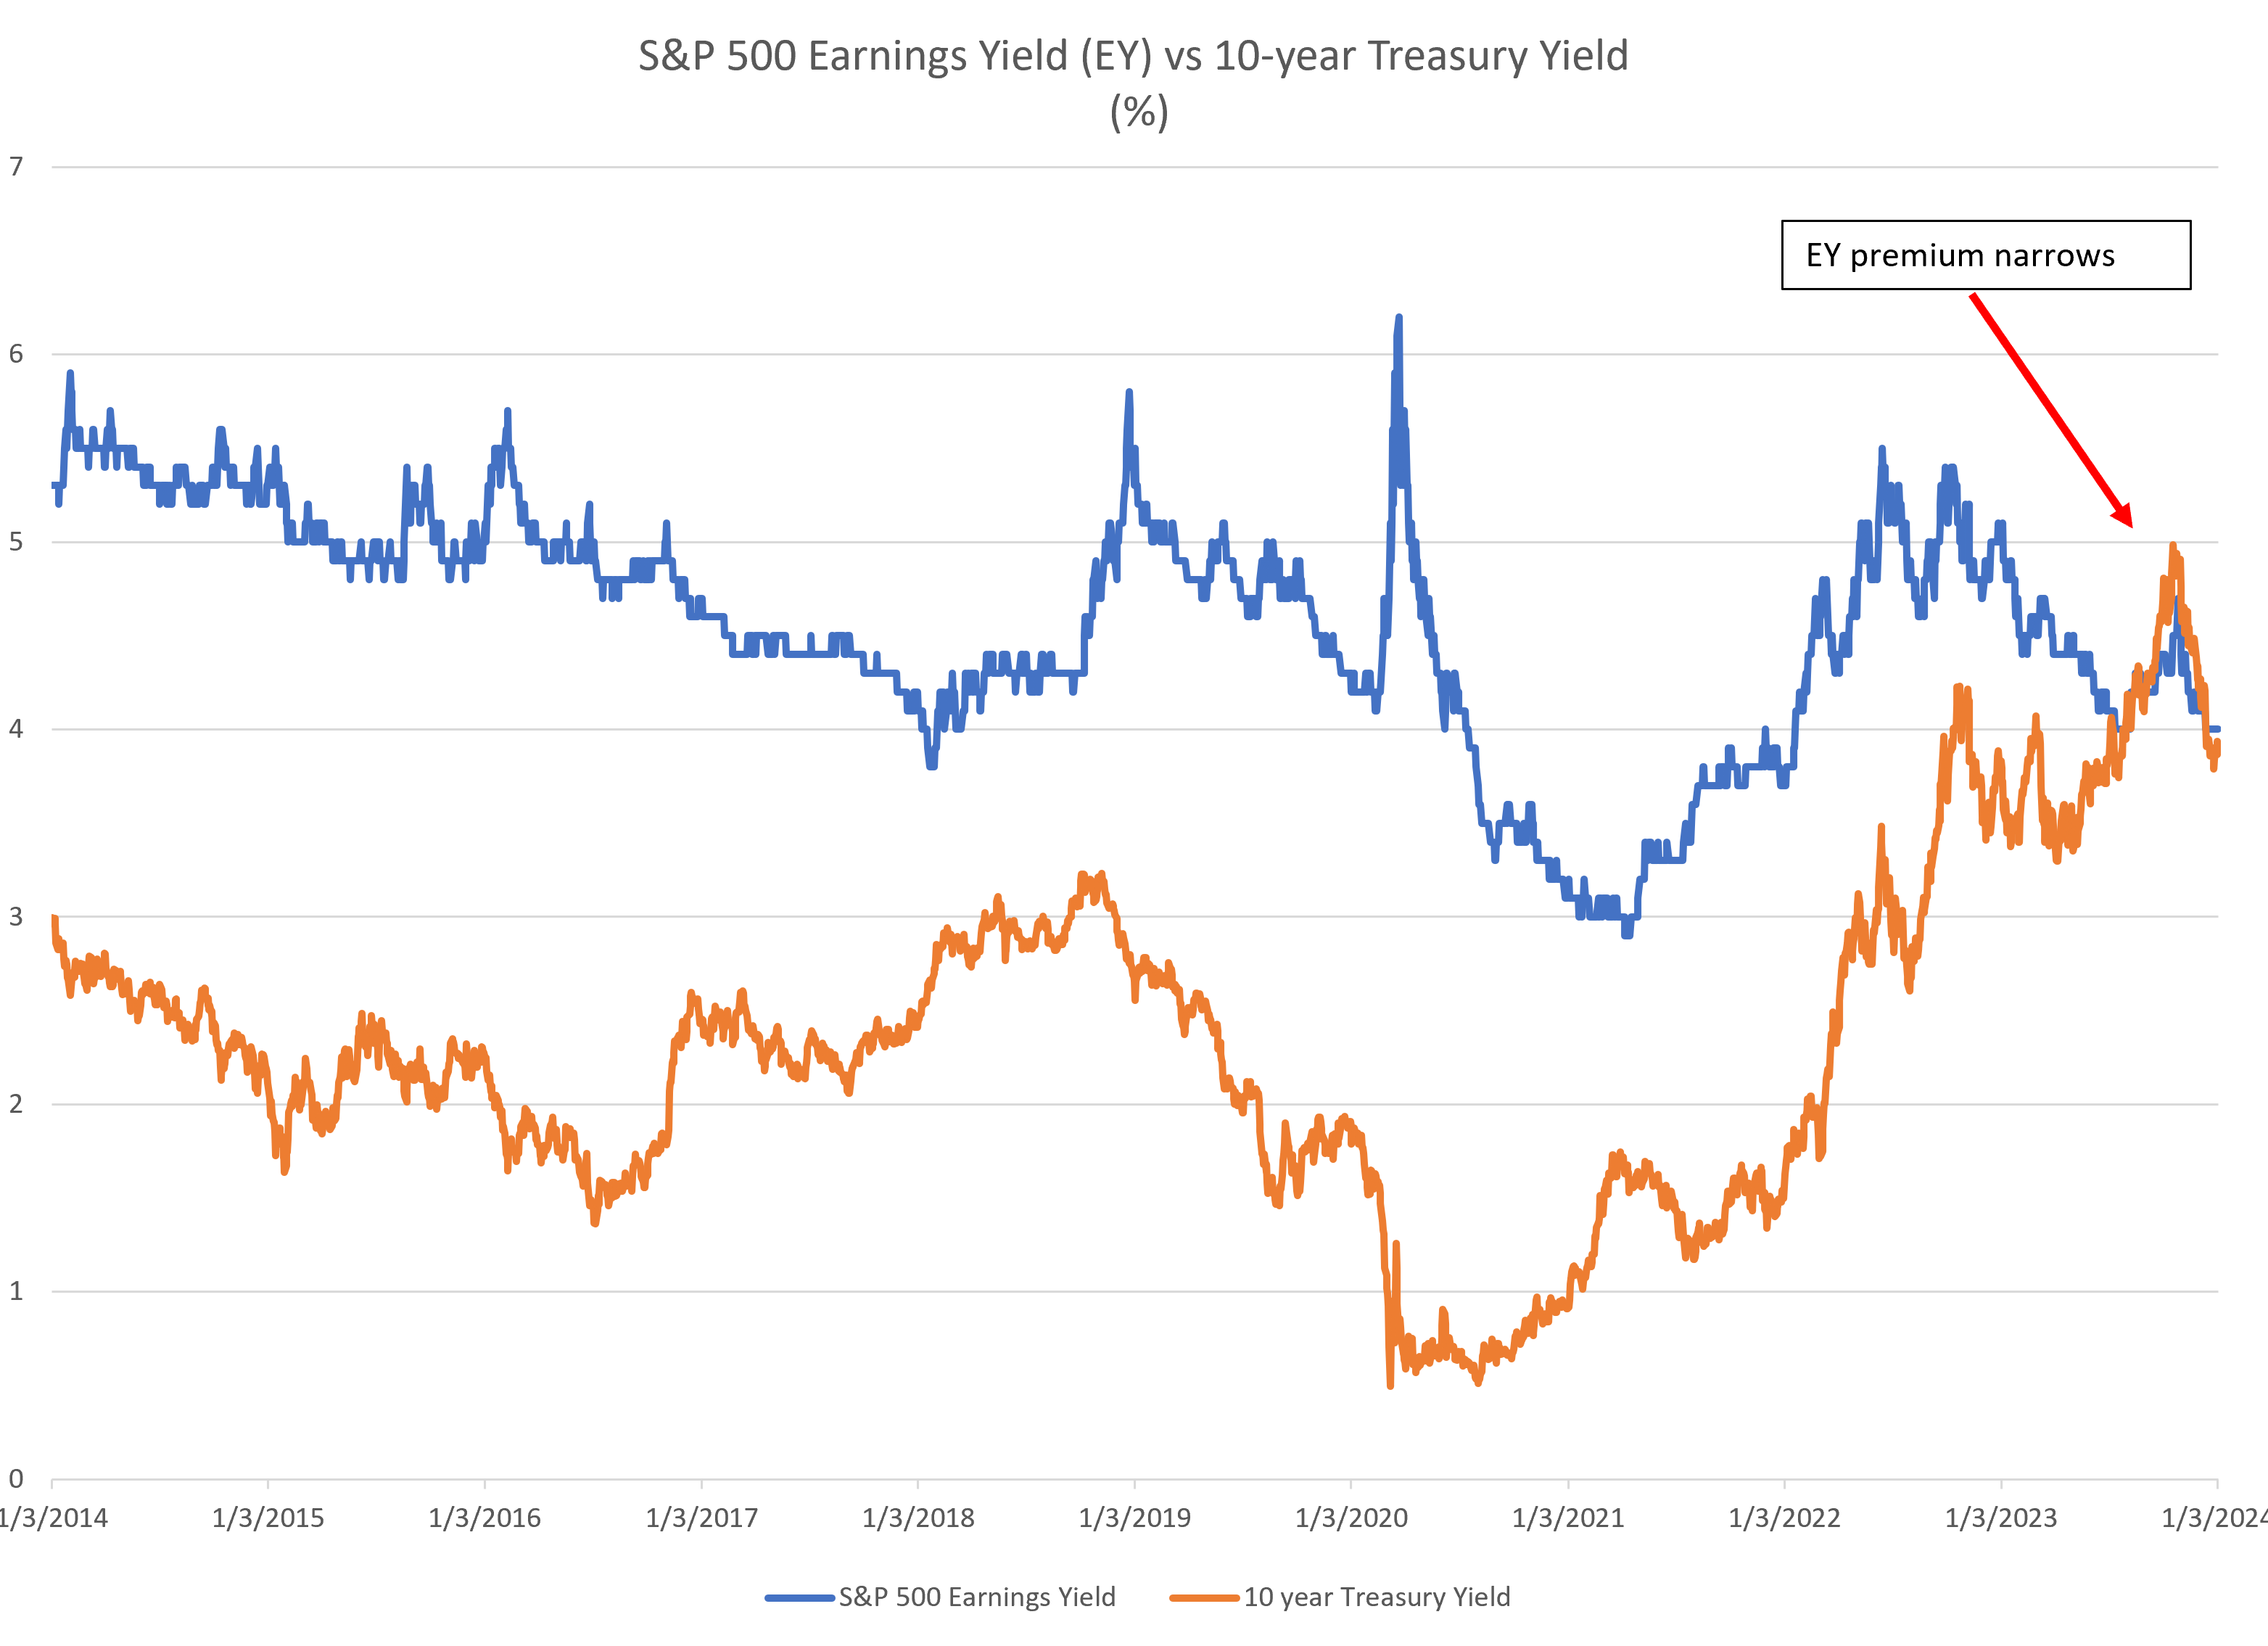
- The spread between the S&P 500 Earnings yield, the inverse of its price-to-earnings ratio (P/E) versus the U.S. Treasury 10-year yield compressed during 2023 as bond yields remain relatively high, while the P/E multiple for equities has expanded, leaving both yields at relatively equal levels.
- Investors are now presented with a There Are Real Alternatives (TARA) environment for equities as the risk premium is negligible for stocks versus bonds.
- The Federal Reserve has hinted it may begin lowering rates during 2024 which could possibly widen the gap again between equities’ earnings yield versus bond yields, granting investors the risk premium required to choose stocks versus bonds.
5. Relative Valuation
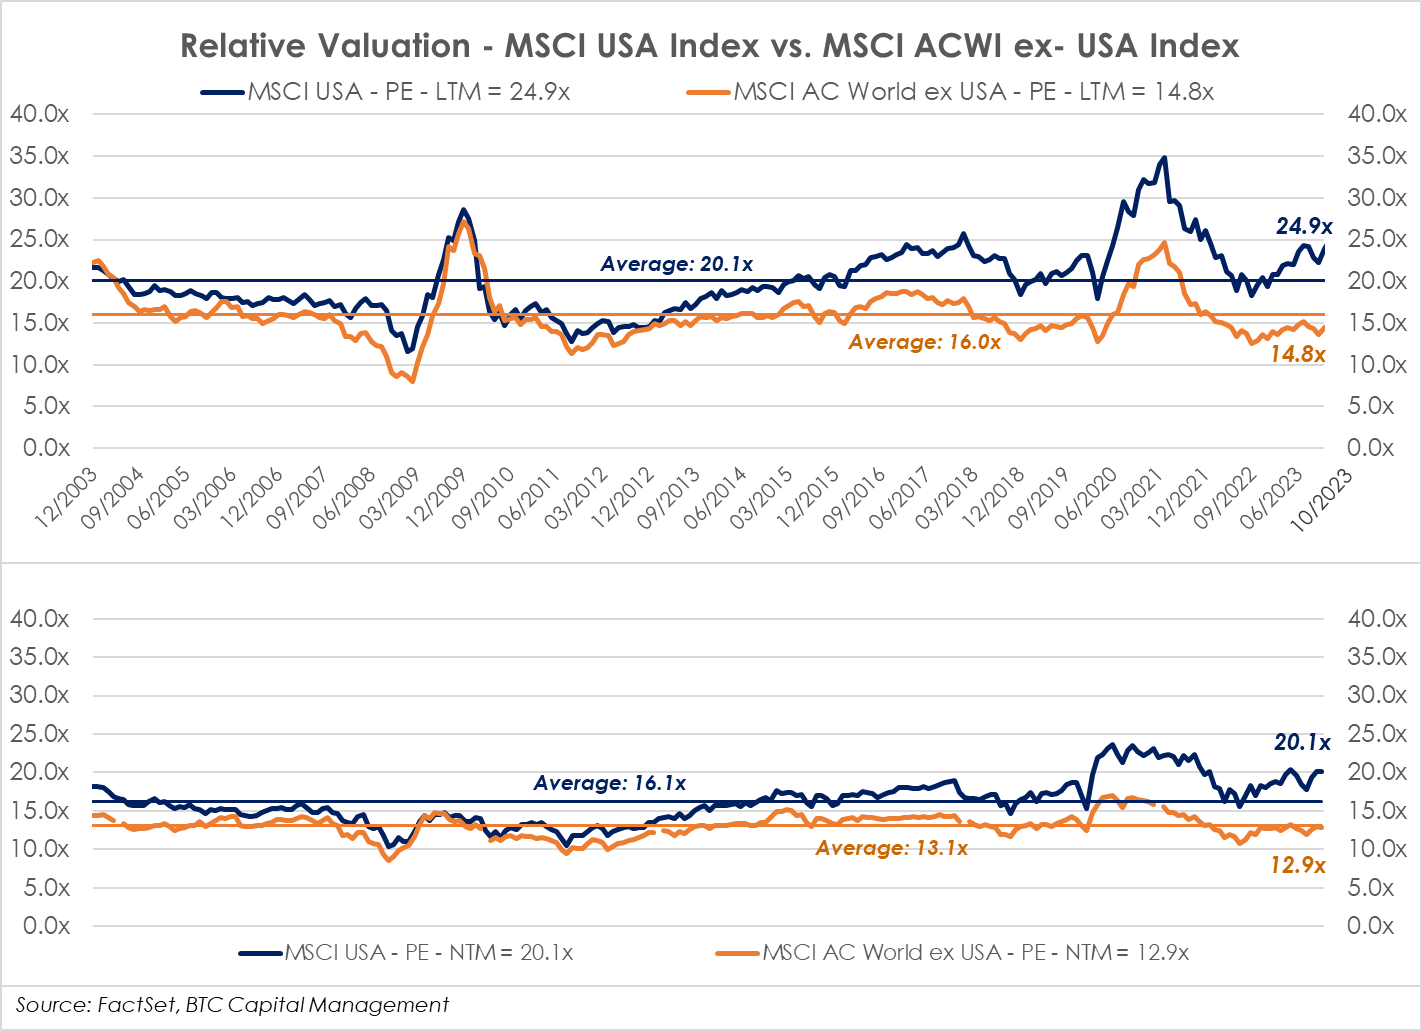
- Valuations for U.S. large cap companies may appear frothy as the price-to-earnings ratio for the last 12 months (P/E LTM) currently is 24.9x, materially above its 20-year average of 20.1x.
- Looking forward, this same measure for the next 12 months (P/E NTM) appears elevated at 20.1x, above its historical average of 16.1x.
- Valuations of foreign-domiciled corporations appear lower than that of their U.S. peers. The P/E LTM for foreign companies currently stands at 14.8x, below the 20-year average of 16.0x. When considering the forward P/E, foreign companies look cheaper at 12.9x also below the historical average of 13.1x.
- Note the estimated growth rate for earnings within U.S. large caps is projected at 11.4% year-over-year (YOY) for the calendar year 2024 which translates to a price-earnings growth (PEG ratio) of 1.8x.
- For foreign companies, earnings are estimated to grow 9.3% YOY, which translates to a PEG ratio of 1.6x.
Sources: BTC Capital Management, Bloomberg Finance L.P., FactSet, PSC Portfolio Strategy, LSEG Refinitiv
The information provided has been obtained from sources deemed reliable, but BTC Capital Management and its affiliates cannot guarantee accuracy. Past performance is not a guarantee of future returns. Performance over periods exceeding 12 months has been annualized.
This document is intended for informational purposes only and is not an offer or solicitation with respect to the purchase or sale of any security. Statements in this report are based on the views of BTC Capital Management and on information available at the time this report was prepared. Rates are subject to change based on market and/or other conditions without notice. This commentary contains no investment recommendations and you should not interpret the statement in this report as investment, tax, legal, and/or financial planning advice. All investments involve risk, including the possible loss of principal. Investments are not FDIC insured and may lose value.