
Welcome to Five in Five, a new monthly publication from the Investment Team at BTC Capital Management. Each month we’ll share graphs around five topics that illustrate the current state of the markets, with brief commentary that can be absorbed in five minutes or less. We hope you find this high-level commentary to be beneficial and complementary to Weekly Insight and Investment Insight.
This month’s Five in Five covers the following topics:
- Misery Index
- Domestic vs. Foreign Equities
- Equity Markets – Different Crisis, Different Outcome
- Yields – Trapping Investors?
- ISM Surveys
1. Misery Index
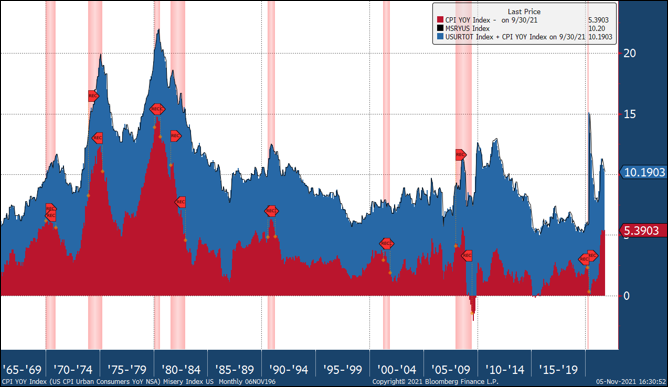
- The Misery Index is the sum of the unemployment rate and the rate of inflation.
- Current reading registers 10.0% using the most recent reports of the unemployment rate and rate of inflation.
- The index registered significantly higher levels in the late 1970s and early 1980s as both inflation and unemployment were at highly elevated levels.
- Current economic forecasts expect both components to trend lower over the course of 2022.
2. Domestic vs. Foreign Equities
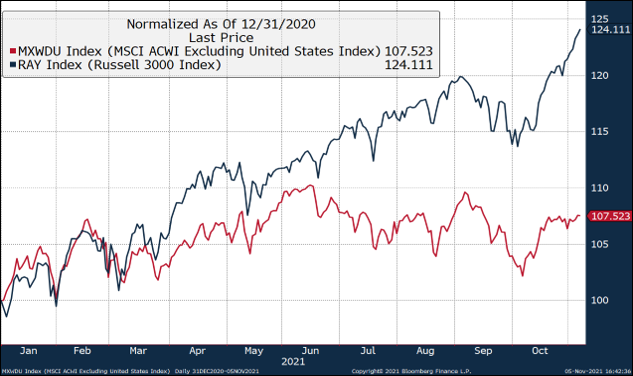
- The performance gap between U.S. and foreign equities has widened in the second half of 2021.
- Countries including Canada and Russia are exceptions with strong year-to-date returns while China and Brazil have generated negative returns.
- The gap may reflect lower economic growth expectations outside the U.S.
- International equities continue to have lower valuation levels with an estimated price-to-earnings ratio of 15.3x for the MSCI ACWI ex USA Index versus the Russell 3000 Index at 23.8x.
3. Equity Markets – Different Crisis, Different Outcome
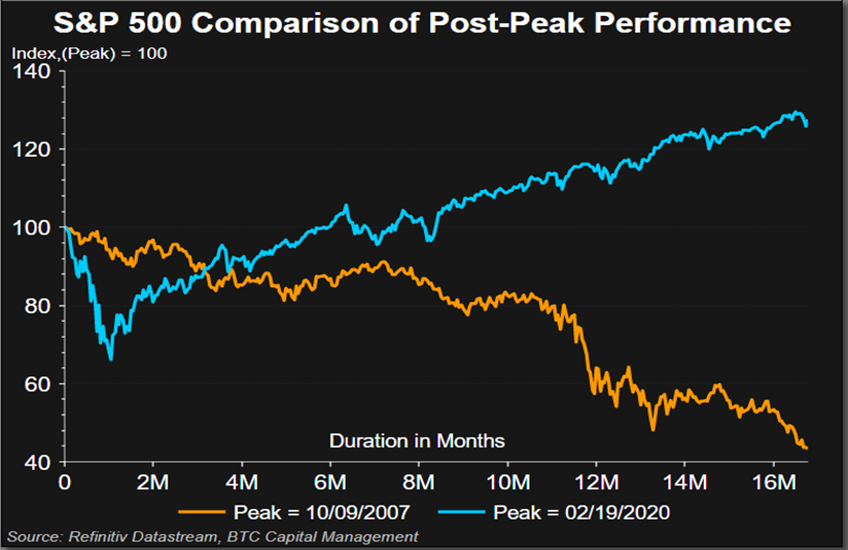
- This chart compares the performance of the S&P 500 for two unique events. Both the post-peak performance for the 16 months following its peak prior to the Great Financial Crisis (GFC) and the 16 months following its peak ahead of the 2020 pandemic.
- Each scenario presents a vastly different outcome. From its peak valuation as of February 19, 2020 through the subsequent 16 months, the S&P 500 rose 21.9% (cumulative price-change only). This differs from the experience involving the GFC, when the index peaked as of October 9, 2007, only to decline 41.9% (cumulative price-change only) over the subsequent 16 months.
- The current environment for equities may appear to be stretched, concerning valuation. The trailing price-to-earnings ratio (P/E) for the index is 25.7x, above its 15-year historical average of 17.4x. Likewise, the forward P/E (next 12 months) is 21.4x, above its 15-year historical average of 15.5x.
- The capability for companies to sustain and enhance earnings is a key component of future price appreciation. According to FactSet, 280 companies have reported earnings for the third quarter of 2021. Year-over-year, earnings have increased 38.3%, while revenues rose 18.4%.
- While the outcomes above compare different market periods, one constant should be emphasized which is to stay invested. Equity investors who maintained their pre-GFC peak exposure of October 9, 2007, would have fully recovered and participated in the subsequent rise through October 29, 2021 of 206.3% (cumulative price-change only). When incorporating dividends, the index rose 309.3% (cumulative), or 10.6% annualized from its pre-GFC peak through October 29, 2021.
4. Yields – Trapping Investors?
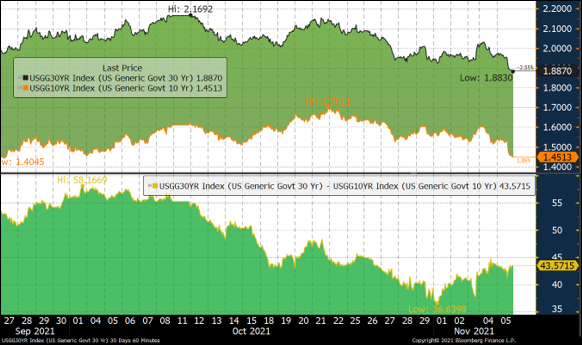
- The 10-year Treasury yield rose 6 basis points (bps) following the Federal Open Market Committee meeting as a dovish lean pushed short-term yields higher. However, since the 11/3/21 meeting the 10-year yield fallen 19 bps. The 30-year fell 18 bps, while the intermediate 5-year dropped 12 bps.
- Global rates on the front of the curve dropped precipitously this week. The market anticipated that hawkish language would lead to hawkish actions, but instead were met with policy makers pushing back against near-term interest rate hike expectations.
- Historically, this would lead to higher interest rates on the long-end as inflation would be allowed to run hotter.
- So what is different? One thing to note is that pre-pandemic the market was pricing a terminal fed funds rate (implied rate 5-years forward) of 3.25%. This has now fallen to below 2.0%.
- One explanation could be that a levered economy is a pull forward of demand and leads to slower growth in the future. Maybe the market is pricing another bazooka fiscal and monetary response when risk assets and the economy falter. Or maybe the slowdown in China is finally making its way across the globe, thereby dampening goods demand and with it commodity inflation.
5. ISM Surveys
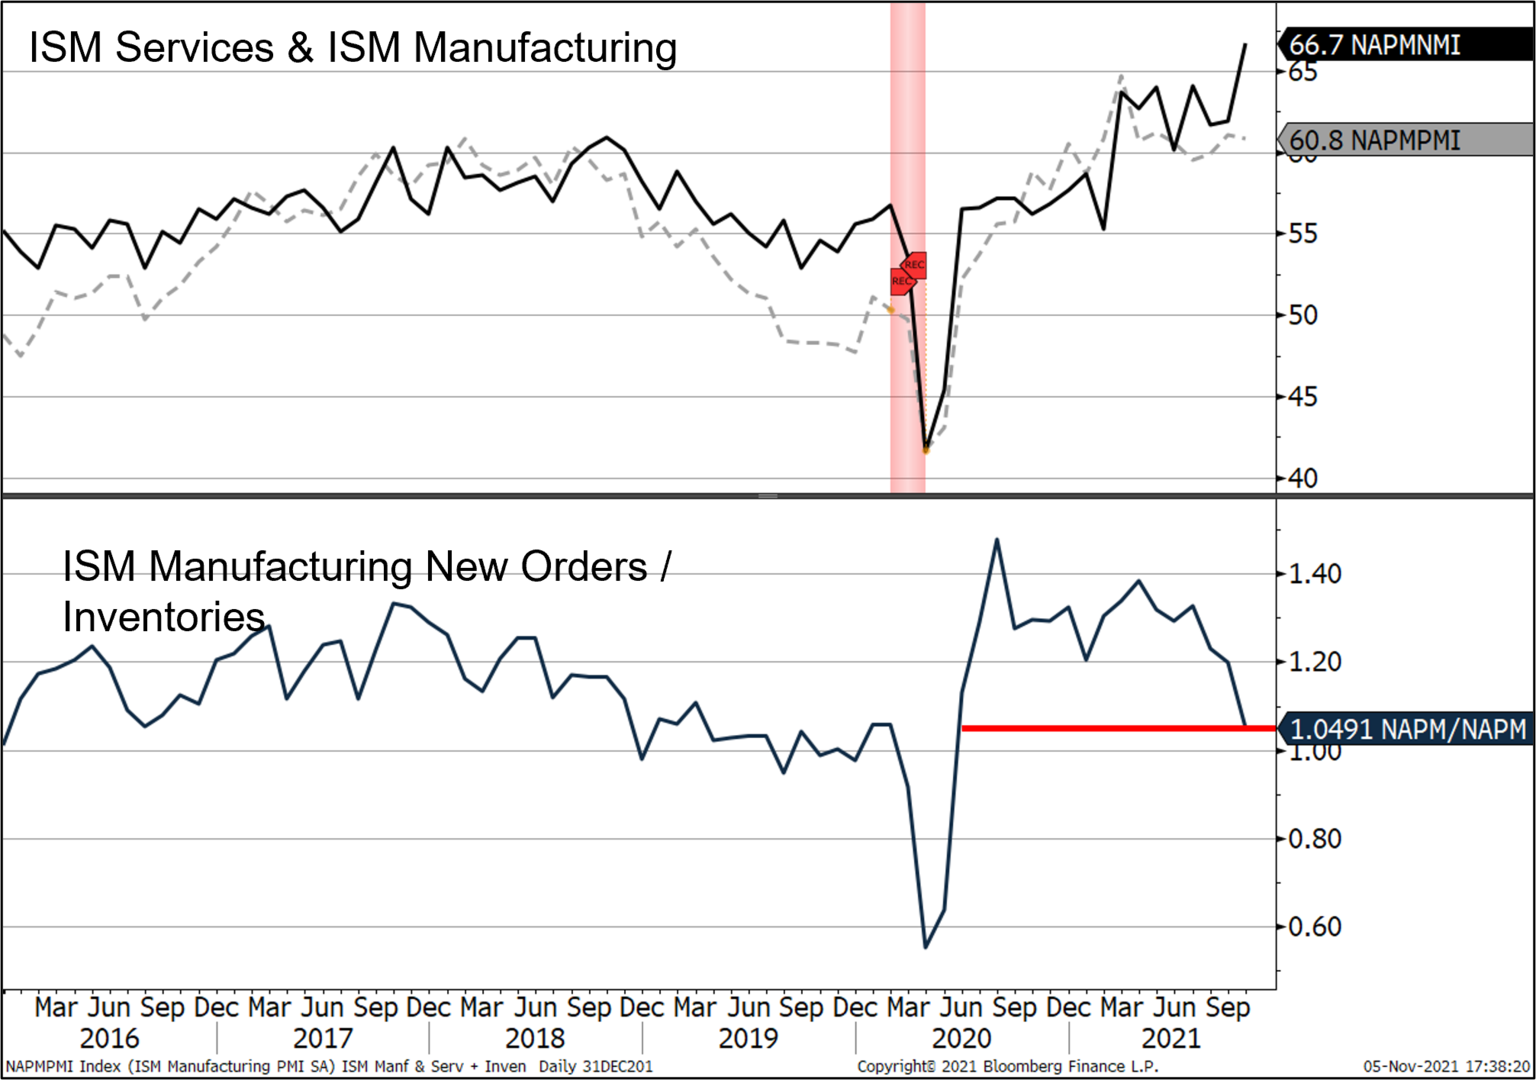
- Readings of 60+ from both the ISM Services and ISM Manufacturing Purchasing Managers’ Index suggest a strong economy.
- ISM Services jumps to the highest reading on record. Also, note the consecutive prints above 60.
- The ratio of ISM Manufacturing New Orders to Inventories is at its lowest level since June of 2020. This generally leads the ISM Manufacturing headline. Will manufacturing decelerate sharply in the coming months? Is this the message from bond yields?
- Conversely, when supply chains are in such disarray it can cause apathy to ordering. We saw a similar dynamic when lumber prices exploded as home builders just stepped aside and paused.
- The economic expansion could be materially enhanced if businesses move from just-in-time to just-in-case, thereby creating a surge in orders once supply chains are resolved. Any fiscal policies or incentives to re-shore Chinese manufacturing only adds to the manufacturing growth outlook.
Source: BTC Capital Management, Bloomberg LP, Ibbotson Associates, FactSet, Refinitiv.
The information provided has been obtained from sources deemed reliable, but BTC Capital Management and its affiliates cannot guarantee accuracy. Past performance is not a guarantee of future returns. Performance over periods exceeding 12 months has been annualized.
The information within this document is for information purposes only and is not intended as an offer or solicitation with respect to the purchase or sale of any security. Statements in this report are based on the views of BTC Capital Management and on information available at the time this report was prepared. Rates are subject to change based on market and/or other conditions without notice. This commentary contains no investment recommendations and you should not interpret the statement in this report as investment, tax, legal, and/or financial planning advice. All investments involve risk, including the possible loss of principal. Investments are not FDIC insured and may lose value.