
Welcome to Five in Five, a monthly publication from the Investment Team at BTC Capital Management. Each month we share graphs around five topics that illustrate the current state of the markets, with brief commentary that can be absorbed in five minutes or less. We hope you find this high-level commentary to be beneficial and complementary to Weekly Insight and Investment Insight.
This month’s Five in Five covers the following topics:
- Term Premium
- Forecasted Size and Style Earnings Growth and P/E
- Vehicle Sales and Retail Sales
- Average Mutual Fund Sector Positioning
- Home Affordability and Sales
1. Term Premium
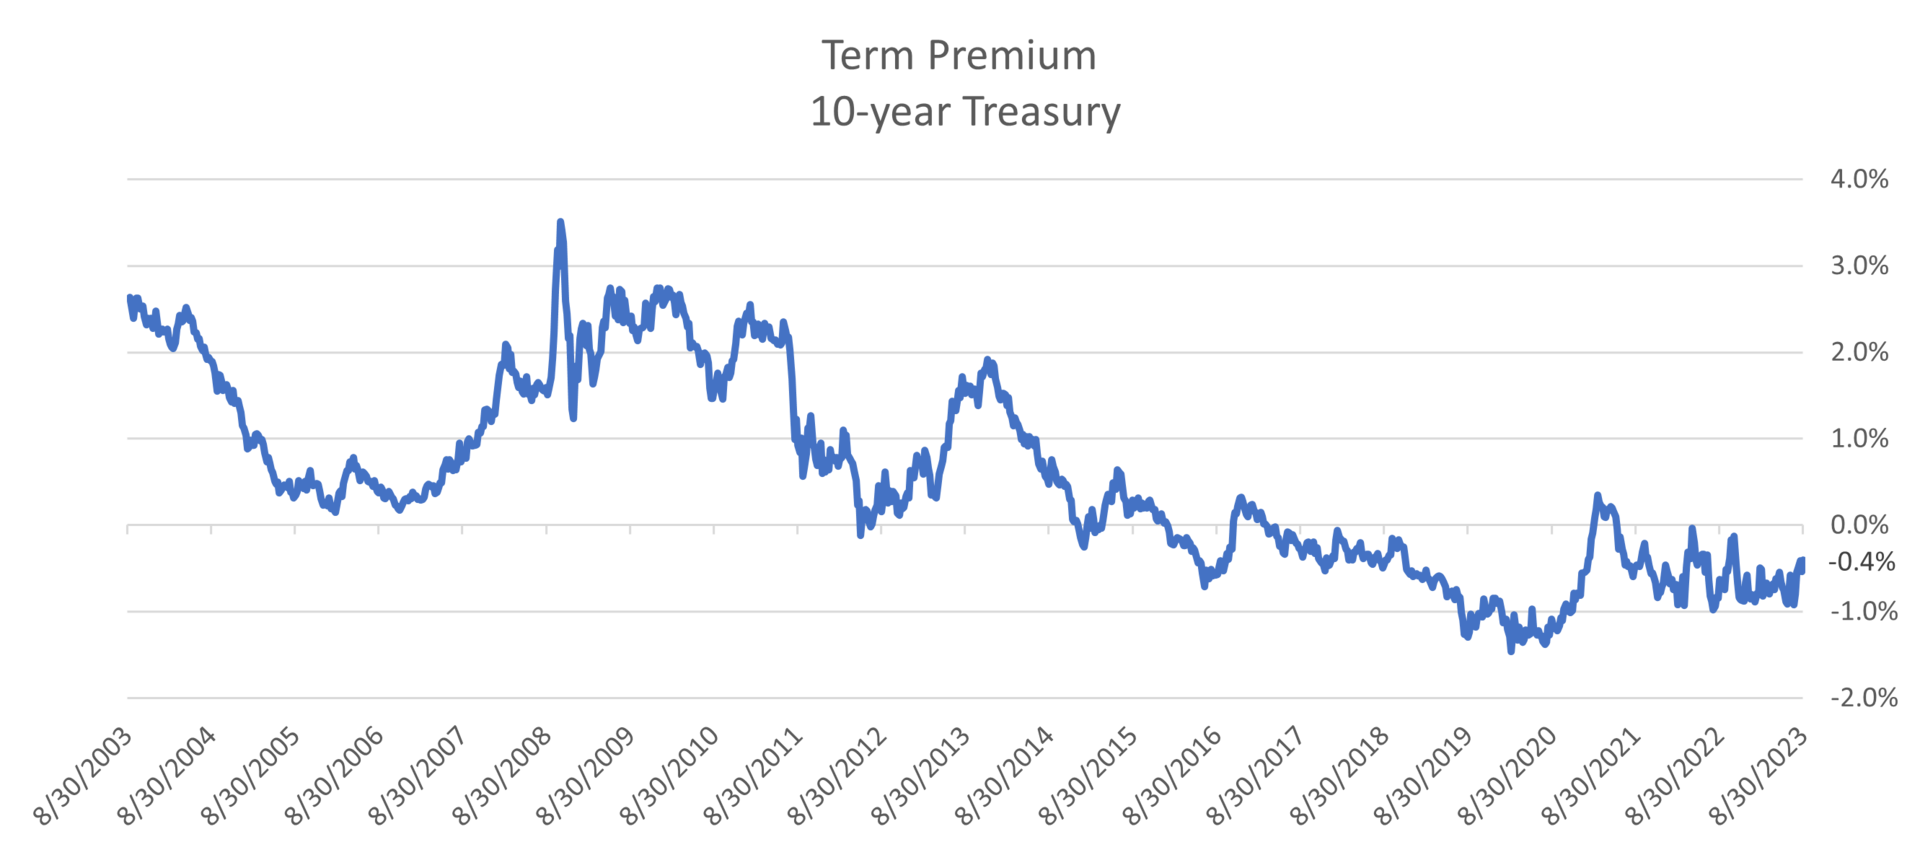
- The term premium is the excess yield investors demand to hold longer maturities instead of a series of short-term bonds.
- The term premium theoretically should always be positive.
- It went negative amid a lower global growth trajectory after the Global Financial Crisis and little risk of inflation shocks.
- Higher inflation volatility and lower diversification characteristics should put upward pressure on the term premium.
- A return to a positive term premium would likely see higher longer-term Treasury yields.
2. Forecasted Size and Style Earnings Growth and P/E

- Analysts are forecasting positive earnings growth for the next 12 months for only a small number of style/size equity categories (Large Cap Core and Large Cap Growth).
- All other style/size categories are expected to see a continuation of earnings decline in the next 12 months as the equity markets have experienced since 2022.
- Price-to-Earnings valuations (P/E) for those two categories are above their 20-year long term averages as investors look to “pay up” for relatively higher earnings growth.
3. Vehicle Sales and Retail Sales
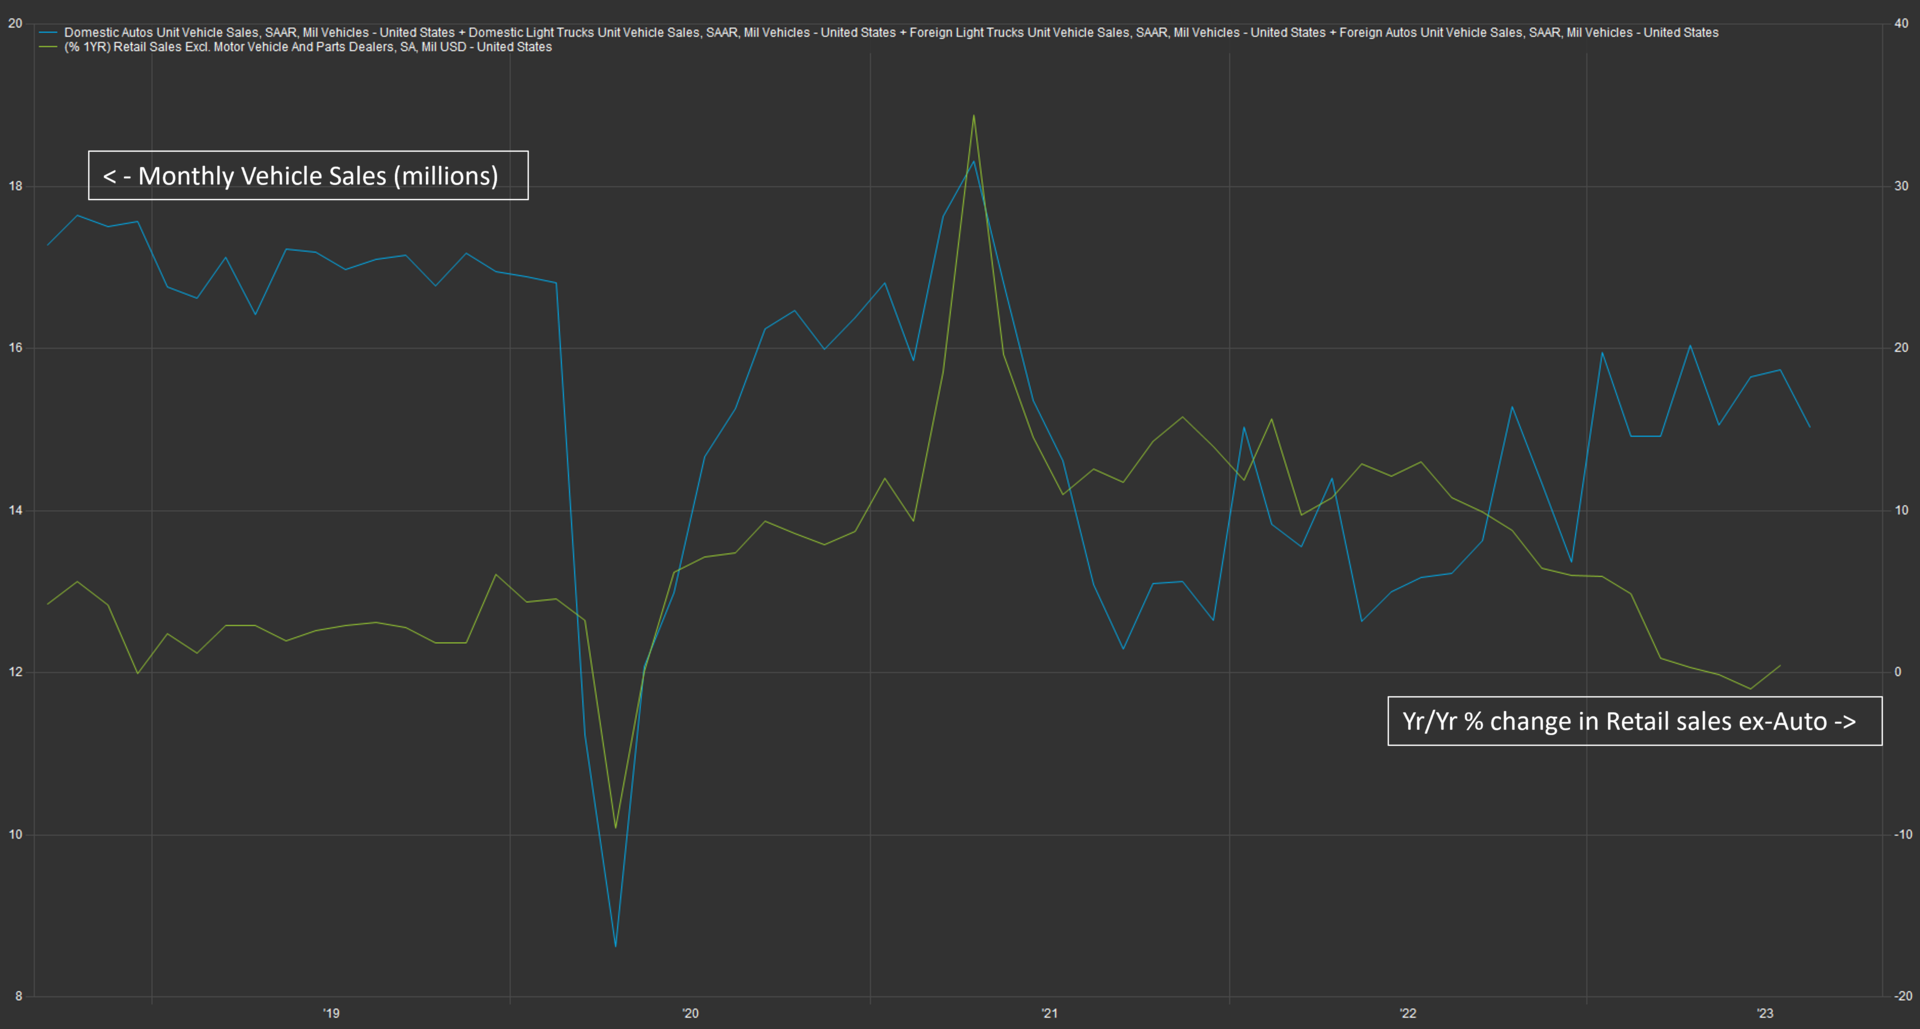
- The U.S. consumer has played a critical part in delaying the forecasted recession with continued strong retail sales representing approximately two thirds of the overall economy.
- However, year-over-year growth in retail sales (green line, right axis) had begun to fall during 2022 when stripping out vehicle sales.
- Vehicle sales (blue line, left axis) have been increasing since early 2022 despite relatively higher interest rates. Vehicle sales have been range bound since the beginning of 2023.
4. Average Mutual Fund Sector Positioning
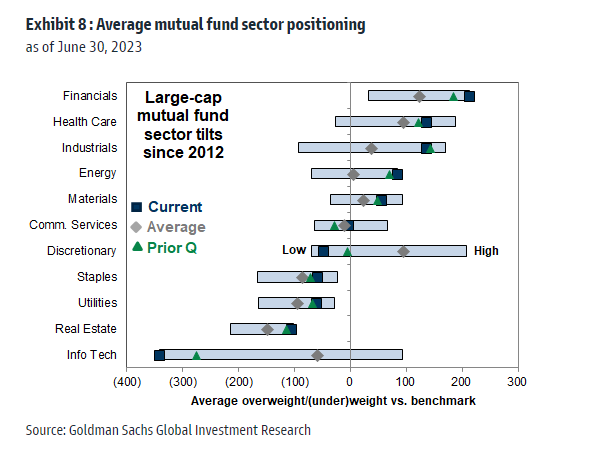
- The graph above shows the 10-year history of sector over/underweights vs. the benchmark in the Large Cap mutual fund universe.
- Currently, Large Cap mutual funds are the highest overweight in the Financials sector going back 10 years. This is despite a rising interest rate environment.
- Large Cap mutual funds are also the most underweight in the Information Technology sector going back 10 years. Certainly, the mega cap tech stocks have been on a tremendous rally year-to-date and now make up a significant amount of the benchmark index. Mutual fund managers have been paring back their weights in this sector most likely for risk management purposes.
5. Home Affordability and Sales
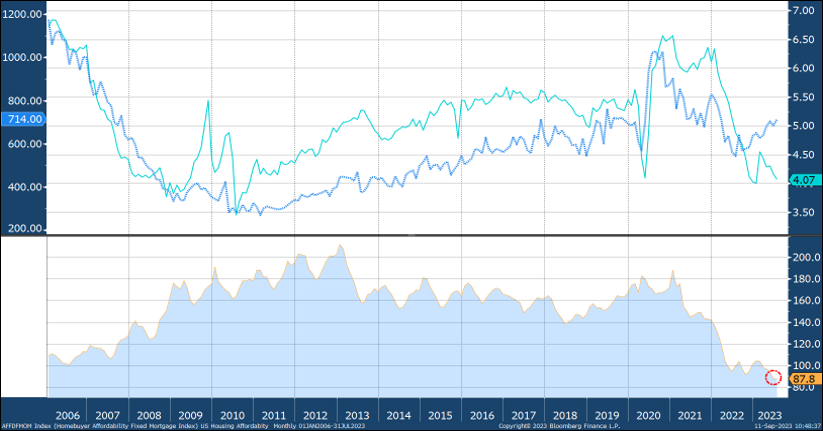
- National Association of Realtors Affordability Index continues to register record low levels.
- Housing affordability continues to struggle with high mortgage rates and high home prices.
- Despite the challenging environment new home sales have increased.
- There have been weak sales of existing homes due to homeowner reluctance to relinquish low-rate mortgages.
- Despite low affordability and weak existing home sales home prices have been rising steadily over the past several months.
Sources: BTC Capital Management, Bloomberg Finance L.P., FactSet, Goldman Sachs Global Investment Research, National Association of Realtors
The information provided has been obtained from sources deemed reliable, but BTC Capital Management and its affiliates cannot guarantee accuracy. Past performance is not a guarantee of future returns. Performance over periods exceeding 12 months has been annualized.
This document is intended for informational purposes only and is not an offer or solicitation with respect to the purchase or sale of any security. Statements in this report are based on the views of BTC Capital Management and on information available at the time this report was prepared. Rates are subject to change based on market and/or other conditions without notice. This commentary contains no investment recommendations and you should not interpret the statement in this report as investment, tax, legal, and/or financial planning advice. All investments involve risk, including the possible loss of principal. Investments are not FDIC insured and may lose value.